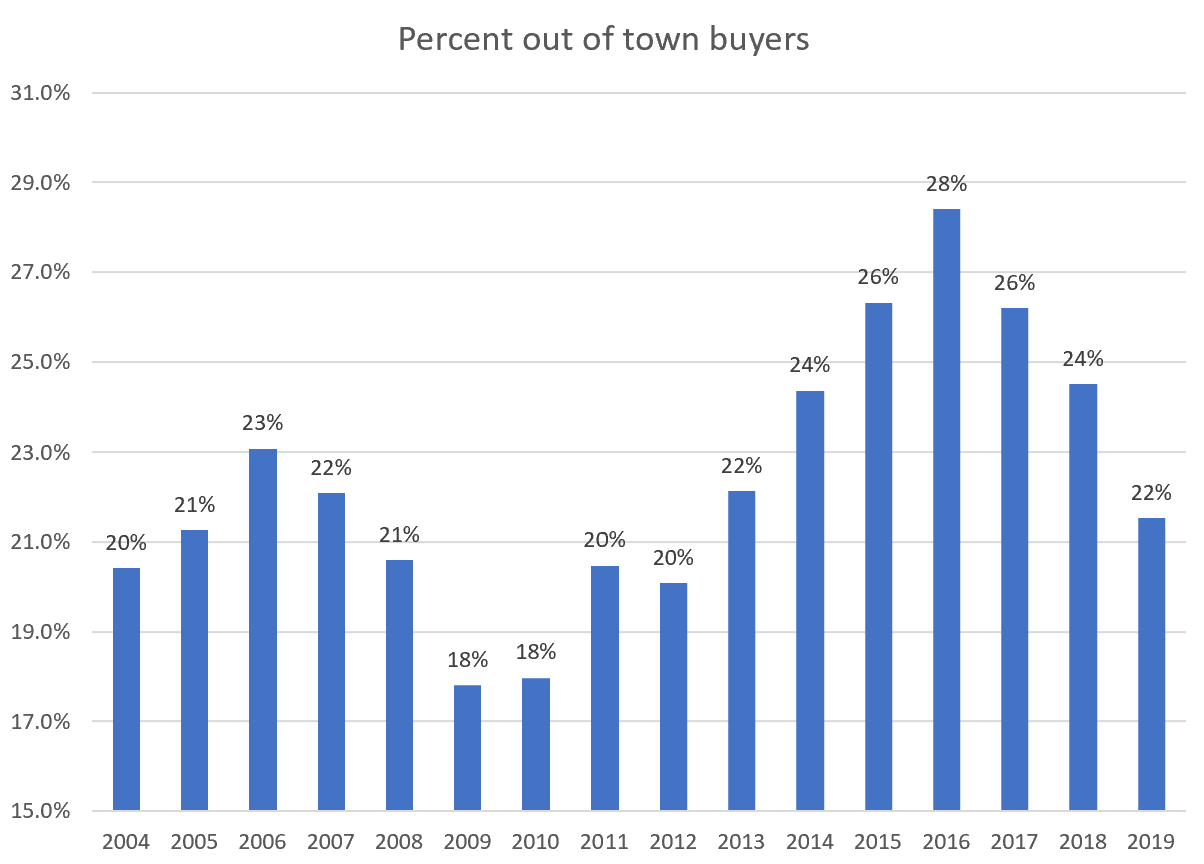
Out of town buyers continued to decrease in 2019
Data for the full year 2019 is in, and it’s clear that the fall back from the extraordinary numbers of out of town buyers we had been seeing in the last few years continued. The percentage of out of town buyers (as measured by the answer to the question “Where is the buyer currently residing?” on sales) came in at 22% which is back to normal levels.
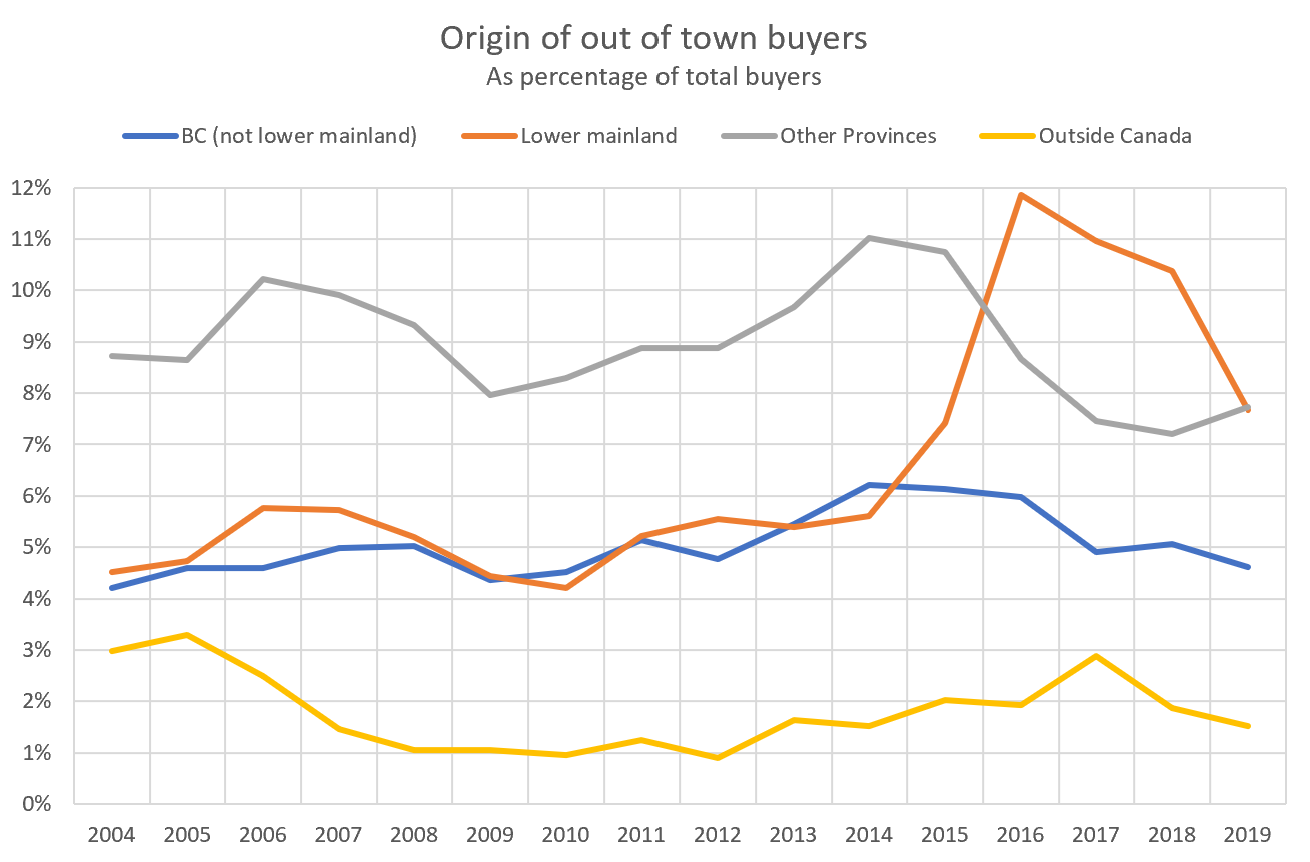
The decline has come from almost all sources of out of town buyers. Lower mainland buyers saw the biggest decline though, as the market over there soured and despite the fact that the spread between Victoria and Vancouver house prices is still large, owners were loathe to lock in their imagined losses from peak prices. Buyers from outside of Canada were reduced via the foreign buyers tax and have stayed at those low levels.
Another way to look at the data is via absolute numbers. Remember that out of town buyers represent pure demand so it’s the number buying here that really matters rather than the percentage. That data shows even more clearly how times of increased out of town buying aligns with price appreciation in the local market.
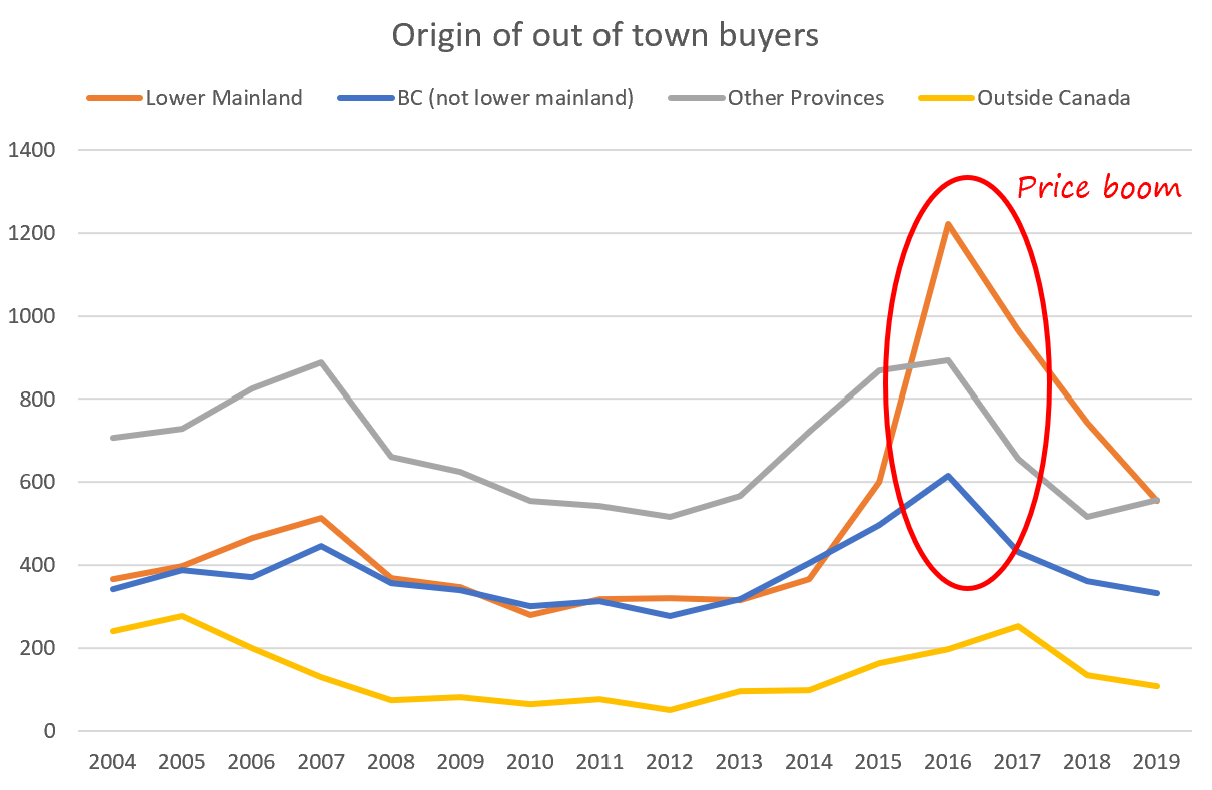
Now with numbers down to more normal levels, we are back to a more local-driven market. While Vancouver market activity has picked up, this has been contained to the lower end so far, and high end homes are still a long way from recovering their peak values.
Also weekly numbers courtesy of the VREB.
| January 2020 |
Jan
2019
|
||||
|---|---|---|---|---|---|
| Wk 1 | Wk 2 | Wk 3 | Wk 4 | ||
| Sales | 17 | 75 | 329 | ||
| New Listings | 94 | 331 | 897 | ||
| Active Listings | 1794 | 1905 | 2057 | ||
| Sales to New Listings | 18% | 23% | 37% | ||
| Sales Projection | — | 300 | |||
| Months of Inventory | 6.3 | ||||
It’s a slow start to the year, with sales down 9% from last year’s already slow levels. However these are small numbers we are talking about so I wouldn’t put much if any stock in them until next week. January 14th last year we had 93 sales or 11.6 sales per business day while this year it’s 10.6. That could easily swing around as the sales pace picks up in the coming weeks.
Hey Rook, there’s a new post but some people are having trouble seeing it due to caching issues. Clear your cache to see it. Ctrl->Shift->R in most browsers will do it.
I’m posting a link to a presentation done by Brent Johnson of Santiago Capital. I’ve been following him a lot lately and was happy he did a talk on Canada and our current macro outlook.
https://youtu.be/UCnDspyzwrw
New post: https://househuntvictoria.ca/2020/01/20/warning-despite-cooling-cycle-prices-look-set-to-rise-this-year/
Teranet for December. Victoria Price index remains at all-time-high (flat +.02% MOM), as does much of Canada.
https://housepriceindex.ca/2020/01/december2019/
“In December the Teranet–National Bank National Composite House Price IndexTM was up 0.2% from the previous month. This was a good showing for a month of December, equalled or bettered in only three of the last 13 years. The composite index for the month was braked by declines of the indexes for Calgary (−0.6%), Edmonton (−0.2%) and Winnipeg (−0.1%). The indexes for Victoria and Vancouver were flat from the month before. The remaining six markets of the composite index were up: Quebec City 0.2%, Ottawa-Gatineau 0.3%, Toronto 0.4%, Montreal 0.4%, Hamilton 0.4%, Halifax 0.7%.
The underlying trend of the index was a return of strength in the second half of the year after a shaky first half. The newfound vigour can be attributed mainly to the indexes for Toronto, Hamilton and more recently Vancouver, Victoria and Quebec City.”
Depends. You’ll have fresh filtered air, but it’s not going to save you anything assuming you have a typical older house (super leaky).
You’re better off putting the money towards air sealing, insulation, windows/door (and then a heat pump) etc.
The fortis chart is out to lunch. Heat pumps these days are 3 to 4 times more efficient than the best NG furnaces. Using QT’s energy costs the heat pump should have the same or lower operating cost. Plus the whole environmental thing which seems to heavily favour electricity.
HRVs absolutely are worth it if you have a semi-efficient house.
The terminology makes sense to me, so it’s possible we are talking about different things.
Using the previous example… If we construct 2000 units, and the the net rental stock grew by 1200, then there must be (2000-1200)=800 rental units retired,
Now in this example, this might have resulted in the Greater Victoria rental stock growing from 60,000 units to 60,000+1,200= 61,200 units. So clearly that is growth, so what is bizarre about the terminology?
That 5350kWh is energy used by us, partially by the heat pump and partially by baseboards. So heat produced from the heat pump is greater (~2x for the HP) then add efficiency for the gas (maybe 85% for ours).
$560 * 10% HRV energy saving = $56 for most of Canada.
$560 * 6% HRV energy saving (realistic number for our mild climate) = $33.60
Cost of filters would easily run $100 per year at 3-4 times annual replacement to protect the honeycomb heat exchanger and to removed dust/pollen. Not factor in the cost of maintenance and services.
Washable filters do not do a good job, and at best it removed up to 70-80% of dust and pollen, combine with homeowner neglects (clog filter) it can lead to heat exchanger and/or blower motor damage.
Fortis does want to sell gas, however they are pretty accurate on calculating the costs for the average BC homeowner (not only for condos and town houses) that consumes just over 900 kWh per month as indicated by BC Hydro, or just over 11,000 kWH per year.
If you went further and use Fortis Home Energy Calculator link that provided on their website it shown that BC Hydro residential Tier 1 rate is $0.0945 kWh, and Fortis residential gas price is $9.1504 GJ.
I’m not going into the nitty gritty cost details, but basic calculation below give a decent picture.
5350kWh * $0.0945 = $505.58 electric cost for the year.
5350kWh = 19.66 GJ * $9.15 = $176.23 gas cost for the year.
What does that chart say about HRVs?
On another note, I really doubt Fortis’s heating cost calculator (no surprise it’s there to sell natural gas). They say a heat pump in Victoria for our size house will use up 8500 kWh in a year. Looking at the differential between summer and winter months, all of our heating uses 5350kWh and that is with baseboards downstairs that basically never turn off in the winter to heat the suite. So for a more normal configuration with just heat pump it would likely be half of Fortis’s calculation.
No
https://www.fortisbc.com/services/natural-gas-services/why-choose-natural-gas/annual-fuel-cost-comparison

Yes
At best HRV true energy saving is somewhere between 10-12% in extreme hot/cold zones, however the cost of maintenance + filters often are much greater than the energy saving. Victoria/Lower Mainland are in mild hot/cold zone hence it make little sense of owning an HRV, unless fresh air exchange/filtered is a requirement for the homeowner (can accomplish same task running furnace fan mode).
http://www.mnshi.umn.edu/kb/scale/hrverv.html
I’m starting to feel like Introvert here, but it wouldn’t be growth then. Bizarre terminology.
Thanks. Not sure what happened there.
“Advertorial in focus magazine talking about the new “Impact MIC” launching here that will offer 40 year mortgages and not be subject to stress test. Comparing payment to rent which they claim is $2156/month for a 2 bedroom. Right….”
One of the principals in this unholy alliance is well-known to me, still owes me money from a couple of decades ago, and is officially the laziest human being in the multiverse. He has zero financial credentials, and the last I heard he was teaching yoga on Hornby Island. Fired from a government job, which we know requires some degree of malfeasance. Your instincts are entirely correct.
Hey, Leo. The quick way of doing blockquotes is busted, by the looks of it.
LeoS formula is correct….
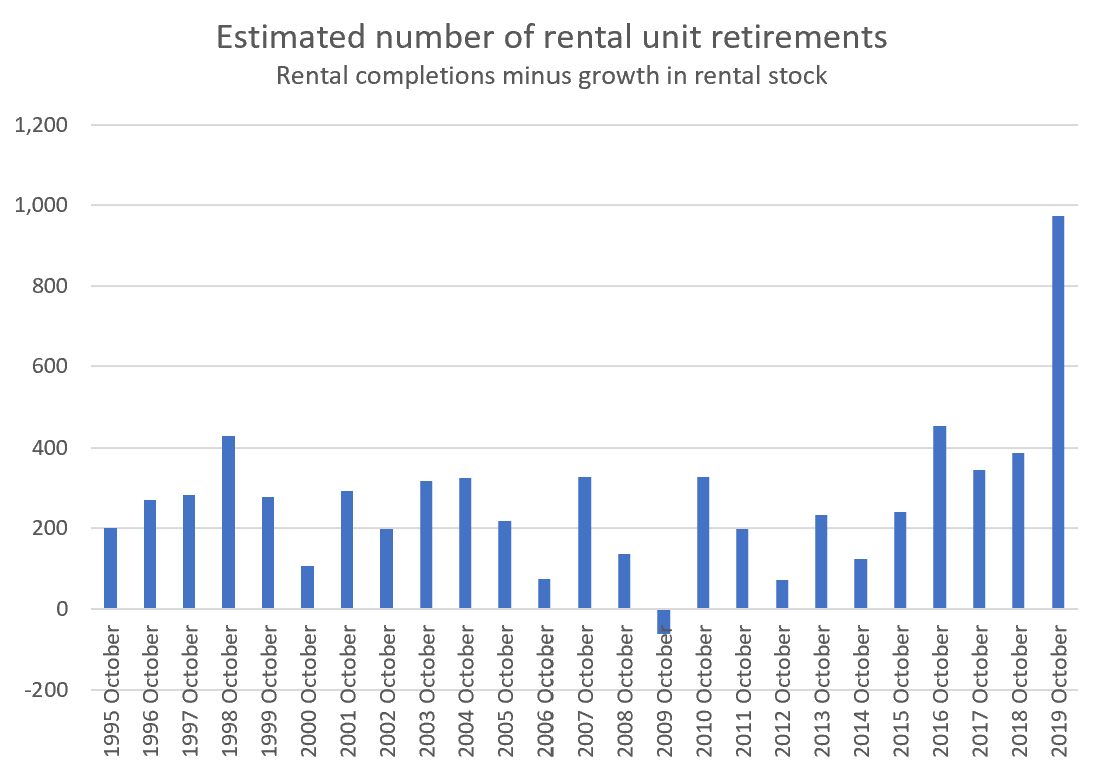
Rental completions minus GrowthInRentalStock = retirements
For example. If we construct 2000 units, and the the net rental stock grew by 1200, then there must be (2000-1200)=800 rental units retired,
Advertorial in focus magazine talking about the new “Impact MIC” launching here that will offer 40 year mortgages and not be subject to stress test. Comparing payment to rent which they claim is $2156/month for a 2 bedroom. Right….
okay, but wouldn’t that be completions plus growth then? not minus? Retirements would be negative growth there wouldn’t it?
I guess I’m just missing what it means.
Thank you sunshine
Batten, dear.
We had a HRV installed in our ON (gas furnace + air conditioner) house, it made a big improvement wrt indoor air quality and humidity, especially in winter season when windows are always closed for 6+ months (also hot summer times).
I understand that a HRV (heat-recovery ventilator) takes in fresh air from outside and takes inside (house) stale air out, so it is about outside/inside air exchange and ventilation (and recovers heat from outgoing air in winter), not really about indoor air redistribution (can’t take basement air to upstairs). Also current Heat-pump systems don’t seem to have this important function.
Of course opening windows does the air exchange, if you can do it all year around. Also the recent new building code – having vents on the exterior walls in some baseboard heated rooms is probably for the same purpose.
Good find. Very high number of retired apartments this year. They were about 500 more than average this year, representing about 500/60,000= 0.8% of rental stock. Which would have increased the vacancy rate from 1.0% to 1.8% if they weren’t retired. Still many moving parts, but it’s a factor for sure.
Canada’s currency is still in a strong position compared to some other areas. I wonder if this will attract more foreign investors should a world wide depression hit? Still if Krystalina Georgieva is correct it’s time to baton down the hatches.
https://www.theguardian.com/business/2020/jan/17/head-of-imf-says-global-economy-risks-return-of-great-depression
Thank you Leo, very interesting! I hadn’t seen this gap graph before. I’m surprised, actually, at how small the gap shown is before 2005.
CMHC tracks the “universe” (aka stock) of purpose built rental every year. In 2018 that was 26,371 units, in 2019 it was 26,889. An increase of 518 units. However there were 1647 rental completions in 2019 and 1177 in 2018. Dates don’t 100% line up so it’s an estimate, but roughly one would expect that 2018 rental stock + completions – retirements = 2019 rental stock
For years that retirements value was averaging about 200 which seems realistic. Somehow in 2019 it jumped to nearly 1000. I’m not 100% confident of the data though, but it is an anomaly
I don’t understand the header of the graph Leo.
Rental completions minus growth in rental stock?
Not broken out by high end single family unfortunately since I don’t have the data for submarkets in Vancouver, but I made a chart showing single family price gap to Vancouver for my article on foreign buying: https://www.capnews.ca/news/foreign-capital-money-laundering-victoria-real-estate
Shows the magnitude of the gap.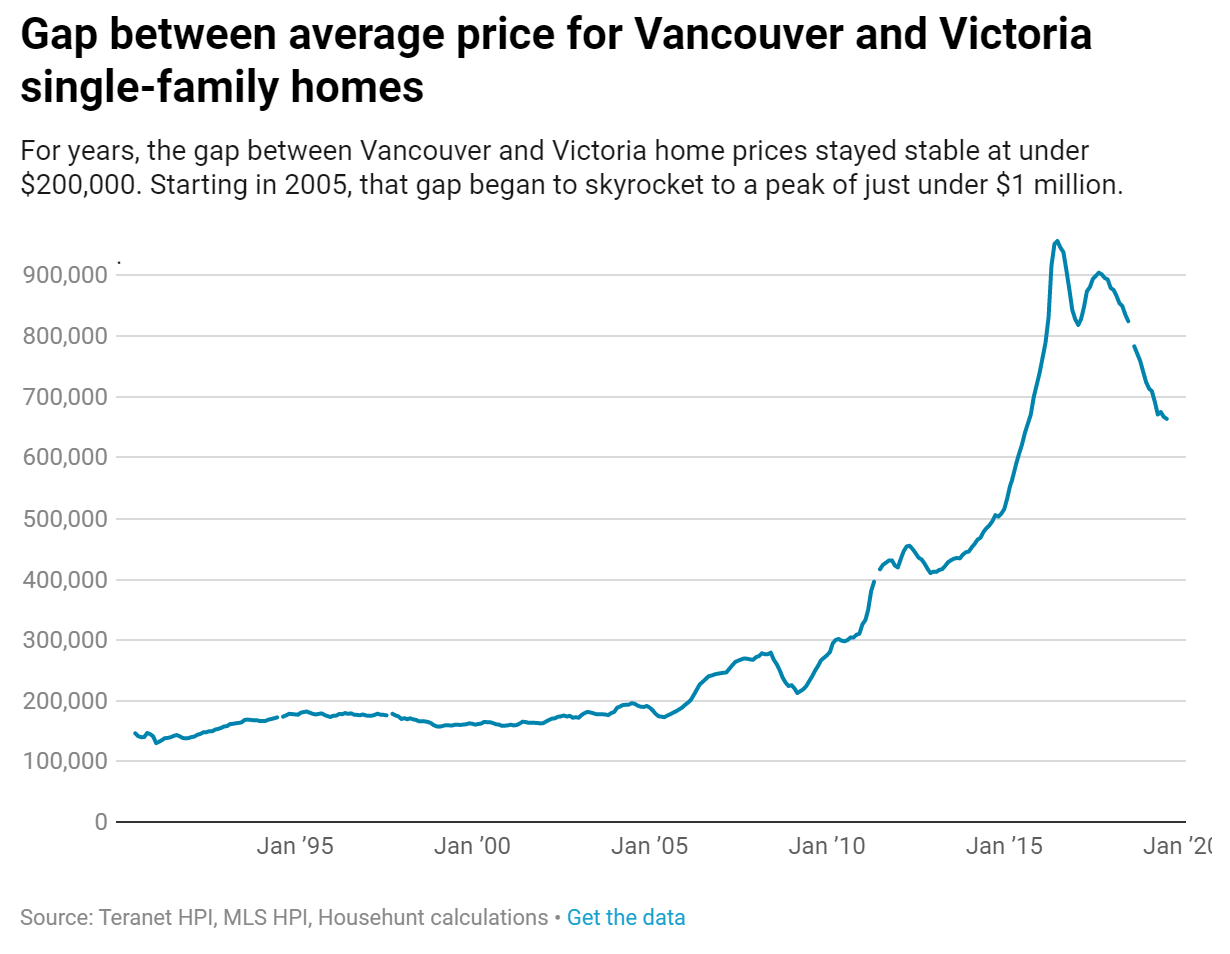
Leo S said: “Just anecdotes based on Vancouver buyers that reached out to me about buying here. I didn’t mean it never happens that people sell lower priced properties to move here, I meant there’s a reason that Vancouver buyers increased radically once it became a possibility to cash out and buy here while keeping lots of money.”
Leo, would you happen to have a chart overlapping Greater Vancouver YOY price (or assessed value) changes compared to Victoria, especially comparing the mid-upper end detached SFH markets in both cities (which are what has been hit hardest)?
It’d be interesting to see how Oak Bay/Fairfield/Gordon Head etc SFH values have fared compared to Vancouver West and North Van regions.
Do you have kids?
Were you ever a kid and had to move?
Things change, and you have to adapt. Such is life.
Doubt it. It isn’t the inspectors job to validate design. They are not engineers. However could be that inspectors in Victoria who are more used to concrete and steel construction may have spotted the issues which I hear are not exactly minor.
The blame here is squarely on the engineers who apparently screwed up the design.
Not likely monetarily worth it because ductwork would have to be modified.
I just run the fan in the summer which does some of the redistribution.
Heat pump is likely a better bet anyway because then you get proper cooling when required and big rebate for upgrade from oil
Shall we speculate that Langford’s love of cutting red tape/building developments at breakneck speed is a factor in this particular clusterfuck?
Check this out:
Not 100% sure if the rental universe data is that reliable from CMHC, sometimes it has made unexplained jumps. Like 1991 it magically grew by 5000 units without any significant rental completions. Seems to be a bit more stable lately though.
Question for the HVAC enthusiasts among us: if one is installing a new gas furnace in an older house in Victoria, is an HRV worthwhile? Is there a way (HRV or otherwise) to get cooler air from the basement distributed through the house ducts in the summer by our furnace? Cheers!
“I just move”…. That’s easy for a single person to do.
But people with a family are faced with “we just move” and that’s not so easy. (kids changing schools, new friends etc.).
Right. I think of a “tear down” as applying to a house, but it appears that there are lots of tear down apartment buildings too.
There are 60,000 rental units in Victoria. If they last 60 years, that’s eventually 1,000 rental tear downs per year. So the 482 seen in Vic. Is about right.
Yeah well those 60s apartment buildings are getting closer to end of life. Got a larger article pending about the rental situation, will be published in the capital likely next week.
Full points to CMHC for predicting the lack of movement in the vacancy rate this year. I think they have more complete data on rental stock age and condition so they can predict retirements better.
Another surprise in the CMHC report about 2019 rentals in Victoria was the small number of net new rental units added – only 628. Even worse, 600 of those were concentrated in Langford, leaving the rest of Victoria with almost no net gain (28) in rental units. There were 1100 new rental units constructed, but 482 got removed/repurposed as they were old . Apparently a lot of rental units are old as “the vast majority of purpose built universe is over 40 years old, and often requires removal from the supply for renovation, demolition, or repurposing.”
https://eppdscrmssa01.blob.core.windows.net/cmhcprodcontainer/sites/cmhc/data-research/publications-reports/rental-market-reports/2019/rental-market-reports-victoria-64471-2020-a01-en.pdf
“In fact, most of the Metro Victoria area saw fewer renter households from 2018 to 2019, and partially this reflects reductions in the overall purpose built rental universe.
In summary, areas in which new construction outpaced removals, new renter households were able to form in order to accommodate population growth, but for most of the metro area, the heightened construction of new units did not effectively increase the purpose built rental supply in 2019.”
February generally it picks up
When do the spring listings start to come on the market?
Everyone is now kicked out of the Langford building. City of Langford is plain lucky this was not a condo. They would have been part of huge lawsuit. Seems this building has some major issues. Interesting to see how this plays out.
Something went terrible wrong that needs to be addressed. Wake up call in how the whole process works.
The article said that an earlier proposal was for five SFHs. Did Saanich council scuttle that proposal?
Just down the road, on Feltham, used to be “the orchard.” This redevelopment is already under construction. I think it’s going to be SFHs. I wonder why a more dense proposal wasn’t approved for that location, too?
It is in Gordon Head.
I’m OK with the University Heights redevelopment. It’s on the corner of two major arterials, so if we have to create clusters of density that is a good place for it. Plus, the mall is old and tired and long overdue for a refresh.
As an introvert, I’d never speak at a council meeting. Thankfully there is e-mail.
It has moral implications, but that has nothing to do with my point. I’m referring to the simple matter of fact that economic expansion is imperfect and always generates excesses. Whether that excess is from greed, miscalculation or whatever, in the end it doesn’t make any difference. Once again, a recession is the cycle’s way of mitigating excess. Hubris doesn’t refer to people, it refers that aspect of growth which is either disproportionate or malign relative to the economy’s actual expansion.
My comment about central bankers preventing recession stands. I agree, in the end they are powerless to stop a recession from coming, but that hasn’t stopped them from trying. Regardless of their +/- 2% mandate, the fact is both the US Fed as well as governments have been more and more interventionist in recessions, which one of the reasons that the perception of risk has been eroded – people are presuming that the Fed has their back in the event of a market meltdown. And so far, that presumption seems to be correct.
This isn’t idle conjecture – just look at the US Fed balance sheet, the ECB, err most of the planet actually. Canada to date has been an outlier, but they can’t hold it off forever. The interventionist paradigm isn’t new either; Greenspan popularized it with what many call the “Greenspan Put” in 1987.
The University heights redevelopment is also back on the table. Not technically Gordon head perhaps but I’m encouraged by these larger scale developments. Hope to speak in support at the hearings
FYI, the first “large” high density development possibility in Gordon Head area:
https://victoria.citified.ca/news/mix-of-condos-townhomes-and-retail-space-envisioned-for-4080-gordon-head-road-at-feltham-road/
Central banks can’t “cancel” recessions (although I bet they wish they could).
The trouble is that you seem to view economics as a morality play, in which the “reckless” and “greedy” ought to be punished — “The hubris must be wiped clean,” you once said.
And you seem to think that, because the Bank of Canada isn’t “allowing” a recession to occur (a power it doesn’t have), it is somehow rewarding the “bad” behaviour of the “reckless” and “greedy.”
No, the BoC is just doing its job, which is simply to try to keep the Canadian economy as strong as possible and to try to maintain inflation at a beneficial level.
Sometimes the “reckless” and “greedy” prosper, and sometimes they don’t. That’s just how it goes.
All it needs is a recession and those numbers will go south all on their own. Central Banks’ relatively recent predilection of “cancelling” recessions is a lot like not allowing forest fires to burn. Sure, seems better today, but in the long run the forest’s health is actually worse off.
You hear that Evan Siddall is stepping down in 2020? I’m no fan of CMHC, but I think Evan has done a pretty decent job at managing the file.
Owning a house isn’t a top priority.
If the cost of living is outpacing my earnings here, I just move.
Completely agree. Jobs is the driver of RE. In-migration is likely one of the strongest factors. CMHC thinks it will go down, but not sure what they are basing that off.
Yes, in BC there have been some months of job losses, mainly outside of Vancouver and Victoria. But overall BC still gained (a small) 7,000 jobs in 2019.
But here in Victoria, it’s different, and is a “good news” story on jobs…
– MOM (Nov19-Dec19) growth of 1700 jobs
– YOY (dec18-dec19) growth of 5700 jobs. This is a large number, represents a 3% increase in the 198K Victoria workforce.
– No wonder our Victoria population increased so much in 2019. Up by 2% or 6200 working age (>15y old) people. Likely more people moved here because of the plentiful jobs.
– And 300 fewer unemployed Victorians in 2019, ending with lowest unemployment in the country at 3.36%
Vancouver had job gains for the month (6,000) and the year (19,000). But since population growth there was so large (2.1%), the Labour force grew by 26,000, so unemployment grew by 7,000.
Source: Labour Force Survey https://www150.statcan.gc.ca/n1/daily-quotidien/200110/t007a-eng.htm
You’ve made many posts here detailing and tracking the monthly new and completing construction totals, describing it as a huge supply of homes to be hitting the market.
For example, in April 2019 you posted “ Should be 2900 new units completed between now and October 2019” https://househuntvictoria.ca/2019/05/01/april-lower-sales-stable-prices/#comment-59248
Why would you care so much about the new supply of construction hitting the market, but “not give a sh*t” about the measured effect on the market – namely a negligible impact and actually a decrease in rental vacancy rate.
Yes, a surprise, but likely due to higher population growth in Victoria than expected. (2% for 2019 vs 1.7% expected)
One explanation for the lower vacancy rate despite high new construction would be if the Greater Victoria population increased more than expected. It was expected that population growth would be 1.7%.
And sure enough, if we look at the actual population growth for Victoria, it was much higher, at 2.0% growth for 2019 (this is measured monthly by the labor force survey https://www150.statcan.gc.ca/n1/daily-quotidien/200110/t007a-eng.htm ) .
Given the 146k dwellings in Victoria, a growth of 2.0% population would require 146 * 2% = 2,920 dwellings. That’s close to the number of completed dwellings (about 3,000). So the vacancy rate would stay close to the same (or decrease slightly if there were more millennials moving out of home into new dwellings).
If the Labour force survey is accurate with the 2% population growth for Victoria, and that trend continues, that is generally bullish for housing, especially in the core. Because the 2% new construction is mainly outside the core, but demand for housing is mainly in the core.
Here’s the article from this month:
https://www.timescolonist.com/business/unemployment-rate-in-greater-victoria-is-canada-s-lowest-1.24050652.
BC has lost jobs in 6 of the last 7 months (guess I didn’t count the month where they spiked the number for the election). In December it lost more than any other province.
Maybe elsewhere in BC, but Victoria has really low unemployment. I know rural BC has been losing jobs due to weak forestry industry, but that does not really impact Victoria.
Here is an article from October about Victoria job market: https://www.timescolonist.com/business/worker-retention-a-concern-in-tight-job-market-1.23975079
Hasn’t BC been losing jobs for the last 6 months? We had a total increase throughout the province of 0.3% over the course of 2019.
I attribute that to the strong labour market.
Not really. I’ve said a number of times that I don’t give a shit.
Soper is gonna be pissed! He was counting on the massive increase in rental supply to lower SFH prices.
Just anecdotes based on Vancouver buyers that reached out to me about buying here. I didn’t mean it never happens that people sell lower priced properties to move here, I meant there’s a reason that Vancouver buyers increased radically once it became a possibility to cash out and buy here while keeping lots of money. Your anecdotes are the same thing. They get much more value because of the price differential.
Big surprise, rental vacancy is down in 2019 to 1% from 1.2% in 2018. Amazing that all that rental construction is being absorbed. More coming but definitely didn’t expect a decrease
So it was a guess, I take it, by your lack of response.
I asked the question because I know two families who, 2-3 years ago, sold their Vancouver townhome for $1-1.2M. One bought a SFH in Oak Bay, and the other bought a SFH in Saanich. For both, it was a lateral move in terms of money, but it was a nice upgrade in terms of property.
Do we know what the typical cash-out-of-Vancouver buyer looks like? Do we have any stats to go on? If not, perhaps you ought to refrain from making declarative statements based on little more than a personal hunch.
Remember to shake any tall evergreen hedges as well.
Remember to clear the drains, it’s gonna get melty
Why does this remind me of Toronto? Now where did I put the snow boots?
Nothing more fun than snow. Occasionally
It’s probably because they’re going to close his workplace tomorrow.
I don’t like you anymore.
No one has said that it did.
This weather is great. Moar please!
Good point. And yes of course I agree that rising Vancouver buyers in Victoria spiked prices in Victoria.
I just don’t think that the falloff in Vancouver buyers was due to falling prices in Vancouver. All classes of Victoria buyers fell, including ROC and Victoria buyers , and their existing home prices weren’t falling.
And I also don’t think that rising/falling Vancouver prices always causes rising/falling Vancouver buyers here (because it didn’t in 2004-2014 when Vancouver buyers stayed constant).
Is this your guess, or do you have evidence to support this?
I said price appreciation in the local market, not Vancouver. I don’t think it’s a far out statement that increased demand in the local market from out of town buyers (pure demand) leads to price pressure.
Your article states “That data [Vancouver buyers in Victoria] shows even more clearly how times of increased out of town buying aligns with price appreciation in the local market.”
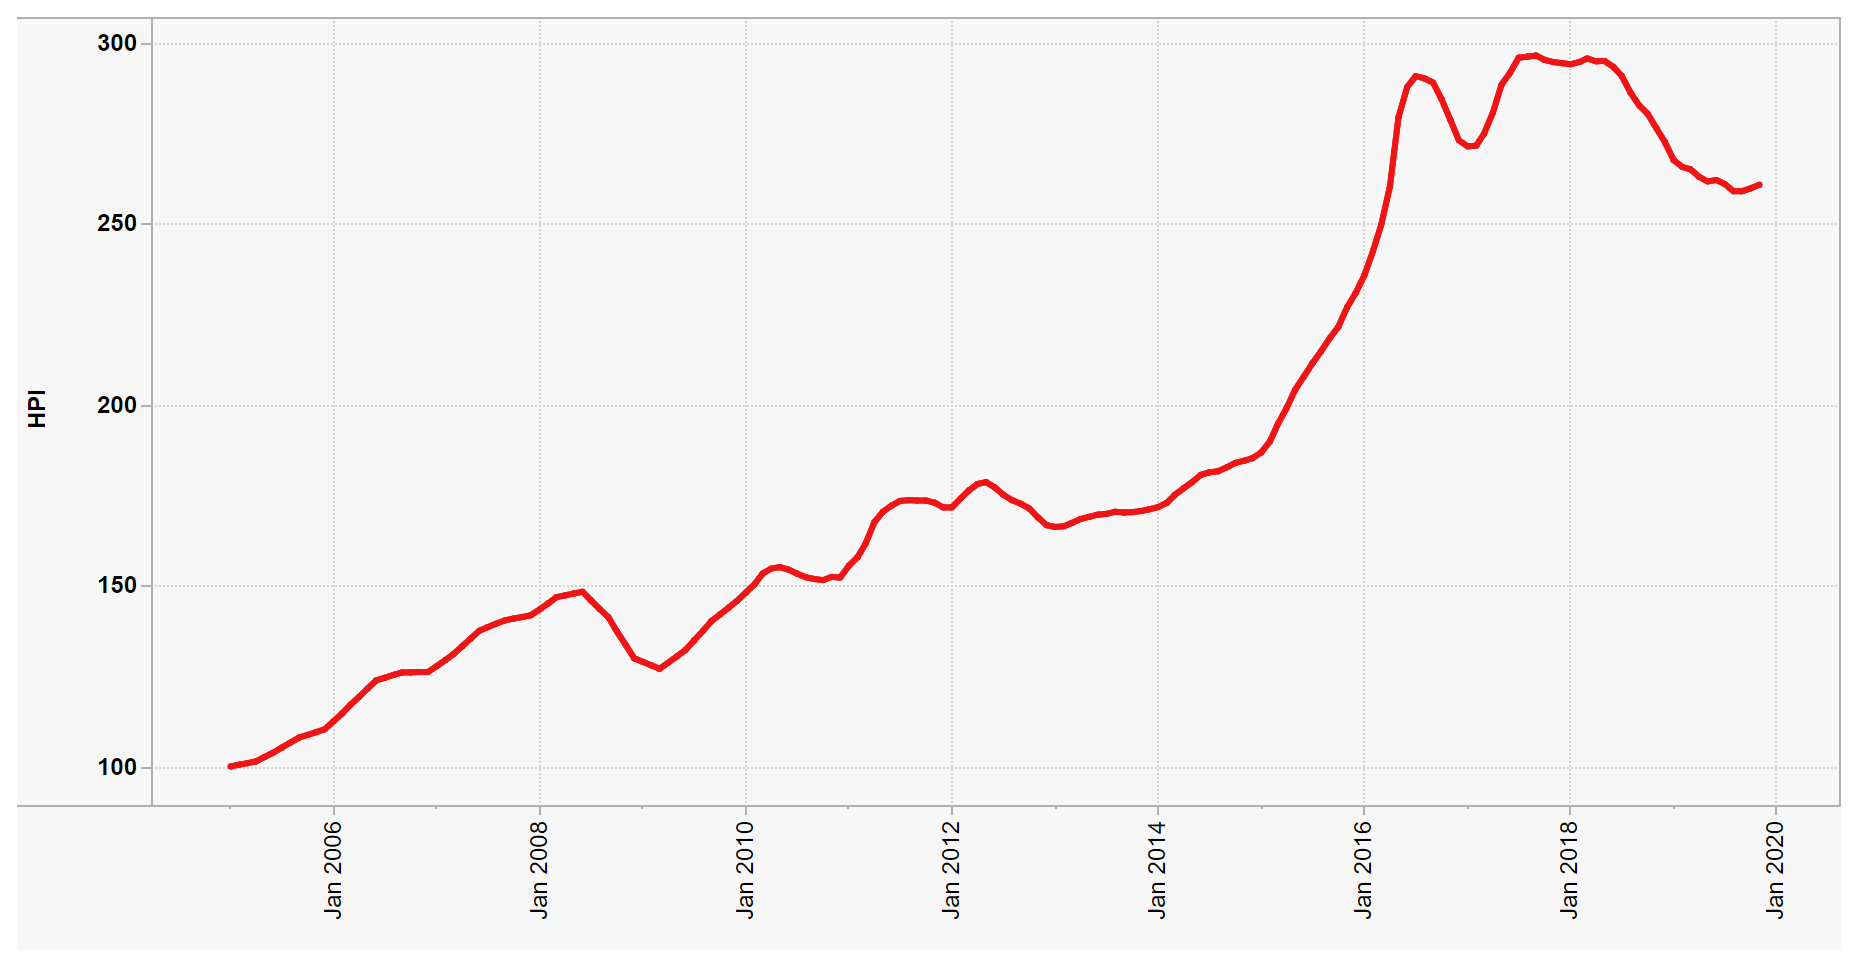
Vancouver house prices doubled from 2004-2014 (Teranet). But number of Vancouver buyers in Victoria stayed remarkably flat. 380 in 2004 and 380 in 2014. Sorry, I’m just not seeing a correlation to support your statement. Likely many factors at play. But thanks for the discussion.
Market activity peak was July 2016 just before foreign buyers tax. Prices also hit (near) peak then although they bounced again in 2017. Regardless prices now are down substantially since then peak in Vancouver which was my statement. Also high end single family is down more than depicted here.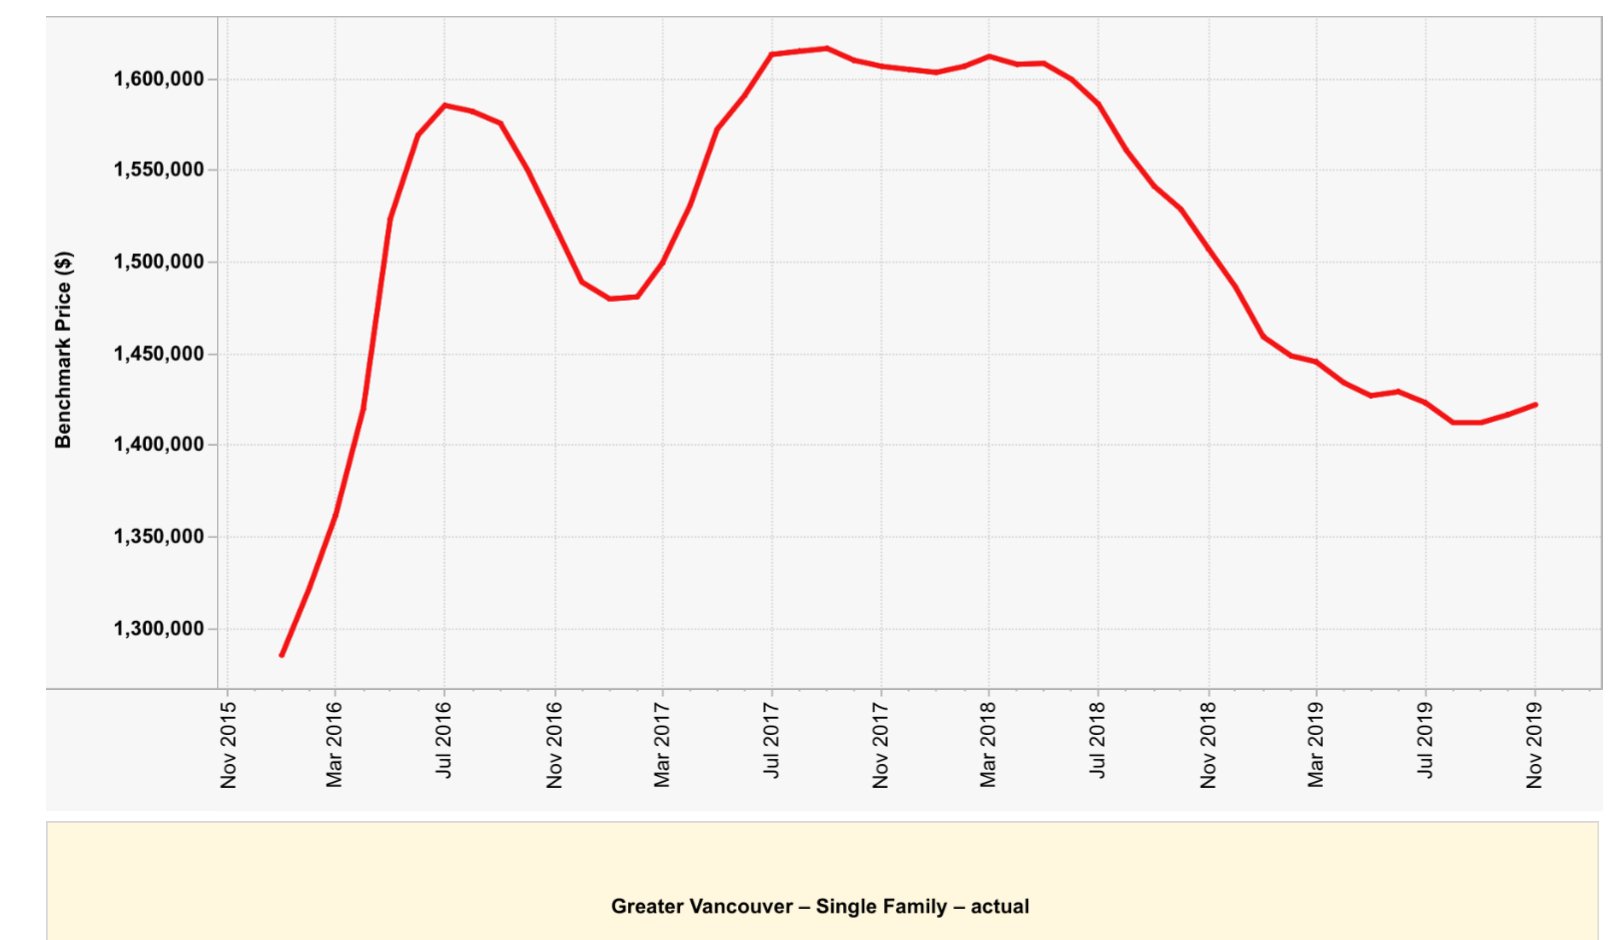
I don’t see how your graph supports that.
On your graph in post 65483 the Vancouver SFH HPI is up 17% from 2016 to 2018, up even MORE than Teranet. From 230 (Jan 2016) to 270 (dec 2018). In that time, Vancouver buyers in Victoria dropped 38% from 1200 to 750 on your graph.
That’s rising SFH HPI Vancouver prices and falling Vancouver buyers in Victoria – opposite to your theory. If your price drop theory was valid, we wouldn’t have seen a drop in Vancouver buyers in Victoria until a drop in Vancouver HPI, which was mid 2018. But Vancouver buyers in Victoria fell hard starting much earlier in 2016 (as shown on your “out of town buyers” chart above)
I’ll have to check but I’m not sure this would be the case. This place was an HBC outfit – I thought they owned everything then. Don’t know if there were fee simple transactions occurring at that time. Perhaps I should consult my little book and see if it says anything. Clearly at some point they were selling parcels of land, but that may have been after San Francisco stole Victoria’s thunder during the end of the gold rush and they wanted to encourage settlement of the miners here. And that was a tough call then.
Victoria’s population was disappearing. Those who remained thought that Britain couldn’t care less about this far-flung outpost, fearing it was doomed to be abandoned. Governor Richard Blanshard dumped his post in 1851 after only a few months, and James Douglas replaced him. Victoria sucked.
Speaking of Richard Blanshard, funny thing was, one of his complaints along with many of the people who left Victoria was…the cost of living was too high.
Heh.
Perhaps, but unless I see evidence of that happening in our market, I wouldn’t consider it within the normal range. And if it did happen at some point in the future I would create a new chart that showed all the data which would make it obvious how anomalous 10% is in the historical context.
Peak insanity in the Vancouver market was 2016. The people cashing out of that market and picking up a SFH here were not those that sold a condo or a low end home in the suburbs for a million. They were ones selling a detached house for a couple million over there to buy here for half the price. So Teranet which tracks all detached houses wouldn’t reflect the high end market.
That high end of the market slowed substantially in 2016 yes (because sellers couldn’t get the crazy prices anymore) and prices now have yet to recover peak values. Look at the MLS HPI for single family in Greater Vancouver which shows prices down overall from 2016. If we could factor out just the high end it would be down much more.
Ah, ok – yes, a mistake to suggest starting at the origin with both axes; meaningless for years, of course.
I still think the graph looks like you’re trying to show more than the data suggests. Maybe they’ll never reach 100%, but out of towners’ proportions can clearly drop to very low levels, well below 10% in some markets. It’s not like it’s easy to see through, but does look like the graph is inflating a relatively modest variation over 15 years.
Regardless of the y-axis used, I don’t see how your charts support your statement above.
Your charts show a drop in Vancouver buyers from 2016 to 2018 from 1200 to 750 (a 38% drop). But Vancouver prices increased by 15 % in that period. https://www.teranet.ca/commercial-solutions-blog/teranet-national-bank-house-price-index-up-moderately-in-april
Since prices rose, clearly price drops weren’t the reason they stopped buying in Victoria from 2016 to 2018. An alternate “simple and harmless” explanation for 38% less Vancouver buyers in 2018 is less Vancouver sellers – due to the 40% fall in Vancouver sales volumes from the peak in 2016.
Good catch. In that case I retract my previous statement about foreign buyer percentages not going to 100% as right around the year 1843 we hit 100% foreign buyers. Although “buyers” is a euphemism in this case
“Totally agree but as I was writing “scrap the homeowner grant” I was imagining the protest from Patrick that little old ladies would be out on the street so I added the qualifier for cover ”
lol fair enough! 🙂
So wait a second here… you’re arguing that the graph should start at year 0?
:s
I don’t agree. First of all, that is very large range in the proportion of out of town buyers. Look at chart 3 with absolute values and tell me there isn’t a big difference between numbers in 2016 vs now. Including zero (or 100%) for that matter would be pointless because the numbers won’t ever go that low or that high. So although percentages completely divorced from the data can go from 0-100%, the data itself cannot.
Also the idea that Y axes must start at zero is not a rule. In most cases a chart is better served by showing the data, not the lack of data. However I’ll leave it to Tufte, the wizard of data vis to explain why. Emphasis mine.
In general, in a time-series, use a baseline that shows the data not the zero point. If the zero point reasonably occurs in plotting the data, fine. But don’t spend a lot of empty vertical space trying to reach down to the zero point at the cost of hiding what is going on in the data line itself. (The book, How to Lie With Statistics, is wrong on this point.)
For examples, all over the place, of absent zero points in time-series, take a look at any major scientific research publication. The scientists want to show their data, not zero.
The urge to contextualize the data is a good one, but context does not come from empty vertical space reaching down to zero, a number which does not even occur in a good many data sets. Instead, for context, show more data horizontally! .
— Edward Tufte
Tufte’s last point is key here. Most RE charts don’t show enough years of data to get a sense of whether the shown data is likely to be noise, signal, a worrying trend, or a completely innocuous one that has appeared before.
Thanks. But I should be clearer in my posts that I’m referring to “disadvantaged” or “vulnerable” people in general, and “little old ladies” is just an example, and now that I think about it, a bad and inaccurate label for that. I think I used it when responding to the assertion by some that virtually everyone is online and should be able to navigate the online spec tax declarations with ease (or easily find someone to help them) . I’m sure everyone here agrees that there there are lots of disadvantaged and vulnerable people of all ages in BC… “Low income”, “disabled”, “mental illness”, “dementia”, “unemployed”, “social assistance”, etc.
I’ll use “disadvantaged” or “vulnerable” from now on, so no more “little old ladies”.
Man, do I ever dislike graphs where the origin does not go to zero for both axes. The percent out of town buyers has ranged in the dataset between 18 and 28 percent. That is not a huge range. Percentages (proportions) by definition go from zero to 100, so you should probably show this full range in the graph.
Totally agree but as I was writing “scrap the homeowner grant” I was imagining the protest from Patrick that little old ladies would be out on the street so I added the qualifier for cover 🙂
Leo S.* In what way do you mean it is staggering?*
I mean inventory is incredibly low for the low end of prices homes.
“Scrap the homeowners grant, at least for any non-elderly non-disabled persons.”
Not sure why the elderly, who are the wealthiest among us, deserve it either unless they are actually poor. If it’s scrapped for me, it damn well better be scrapped for wealthy older people. They already get insane amounts of government funding, had way better wage/cost of housing ratio when they bought, better wages generally, got to work an extra 5-10 years since they got jobs out of high school, skipped tuition since many skipped higher-ed, lived through ridiculous housing booms that made their cheap house worth a million, etc.
https://www.gensqueeze.ca/measuring_age_gap_in_social_spending
“At the time of this report, Canadian governments combined spend between $33,321 and $40,152 per person age 65+, $13,635 and $14,800 per person age 45 to 64, and $10,406 and $11,614 per person under 45.”
The weather is rather fun and likely short lived. Introverts Canadian status is hereby revoked.
Don’t think it’ll pick up this week…
I think this weather is gross.
I was under the impression that inventory was pretty close to normal?
In what way do you mean it is staggering?
LeoS: They never cut the income taxes; better chance of repealing the law of gravity.
Leo, have you done a post on inventory? The inventory for low end homes/townhomes is staggering. Any thoughts on why? Is this a normal part of the cycle in housing history?
Scrap the homeowners grant, at least for any non-elderly non-disabled persons. https://www.timescolonist.com/opinion/editorials/editorial-homeowner-grant-benefits-those-who-have-least-need-for-it-1.24050919
Take the savings and cut income taxes by equivalent amount.