
Warning: Despite cooling cycle, prices look set to rise this year
In light of recent market conditions, I wanted to talk a little bit more about what I mean by a long term cooling cycle, and how that doesn’t mean that price increases are behind us. In fact, with current market conditions it looks likely that we will see price increases this year unless conditions take a turn for the worse.
I’ve said a number of times in the past that I believe we are in a longer term cooling cycle. What does this really mean and is it synonymous with falling prices? Well market conditions are generally measured by one of two metrics: Months of Inventory, or Sales to New Listings Ratio. Months of inventory is how many months it would take to sell all the available inventory at the current sales rate (sales / inventory). In my opinion it is the best measure of the supply/demand balance in the entire market, and a balanced market is around 5-7 months of inventory. In a balanced market we would expect price increases at around the rate of inflation. Seller’s markets have months of inventory below 5 and lead to rising prices, and buyers markets higher than around 7 are associated with falling prices. The one issue with months of inventory is that the measure tends to lag current market conditions. When demand picks up or slows down suddenly, it takes a while for existing inventory to be sold off or build up so the measure lags the market somewhat. The Sales to New Listings Ratio is a bit more immediate as it represents only the current month’s sales compared to new listings that month.
Both measures are highly seasonal as can be seen in the chart of the sales to new listings ratio below, so in order to interpret them you have to strip out seasonality by seasonally adjusting or taking the 12 month average, the latter of which I’ve done for the following charts in this article.
Here’s how that cycle has looked since 1997, which is as far back as we have inventory data.
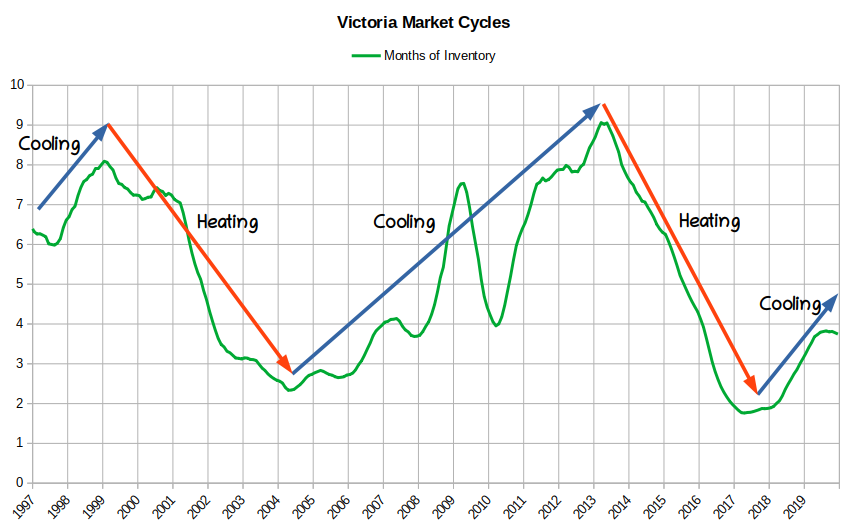
A few things to notice on this chart:
- The last cooling cycle took about 9 years and spanned the great financial crisis (that’s the “wiggle” in 2008/09). The one before that (based on SNLR) took 7 years.
- We are about 3 years into the current cycle since the market turned around.
- Cooling cycles are not smooth. Even in the 12 month average there are periods in 2005 and 2007 where the market strengthens for many months at a time before resuming the cooling trend.
We hit peak market insanity around 2016/17 and since 2018 the market has cooled off considerably. We haven’t seen any price appreciation in 2 years, so as the cooling cycle continues we should see price declines coming up right? Not necessarily.
Let’s go back to the relationship between months of inventory and price changes historically in Victoria. Note that as mentioned above we only have data since 1996 so this is a bit limited, but it’s the best we have.
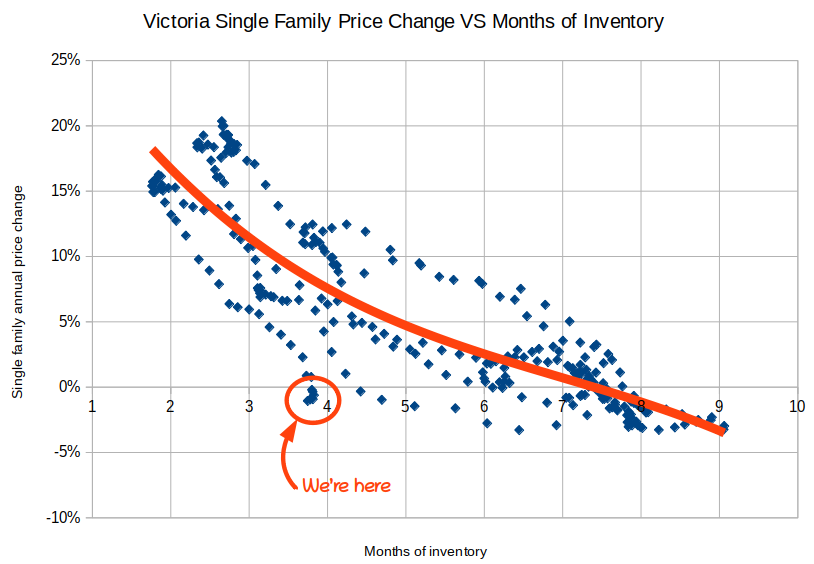
You can see that we are substantially off the expected path for price changes given the actual market conditions out there. In the past, market conditions with just under 4 months of inventory like we have now would have produced annual house price increases of 5-10%. And yet we have seen no price appreciation and even some gentle declines in prices. Why? Instead of gradually cooling off due to affordability constraints, this time the federal mortgage stress took out 20% of buyers in one fell swoop. That demand shock sent the market reeling, and stopped price appreciation in its tracks.
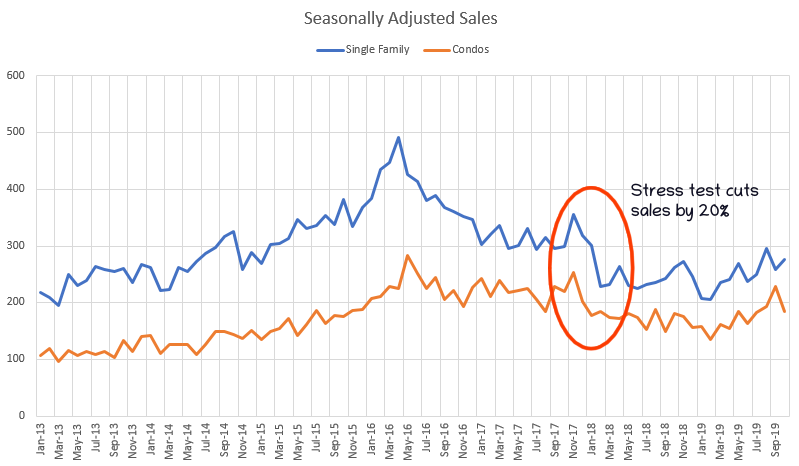
Now, if the market had kept cooling at about the pace we saw in 2018 and the first half of 2019, market conditions would have gotten to where price declines would happen naturally (months of inventory over about 7.5). So the shock of the stress test could have bridged us to a true buyers market. However that doesn’t appear to be what’s happening anymore. As I identified a few months back, the trend of cooling market conditions reversed and sales recovered somewhat from the stress test. If that trend holds and we stay at this level for a while instead of cooling further, then price increases are nearly inevitable.
Another way to look at the same data is to compare the previous cycle to this one directly. For this we normalize them both to when the market started really picking up and months of inventory started dropping quickly. That was mid 2013 in the current cycle, and early 2001 for the 2000’s cycle. Then it looks like this with red representing the current cycle.
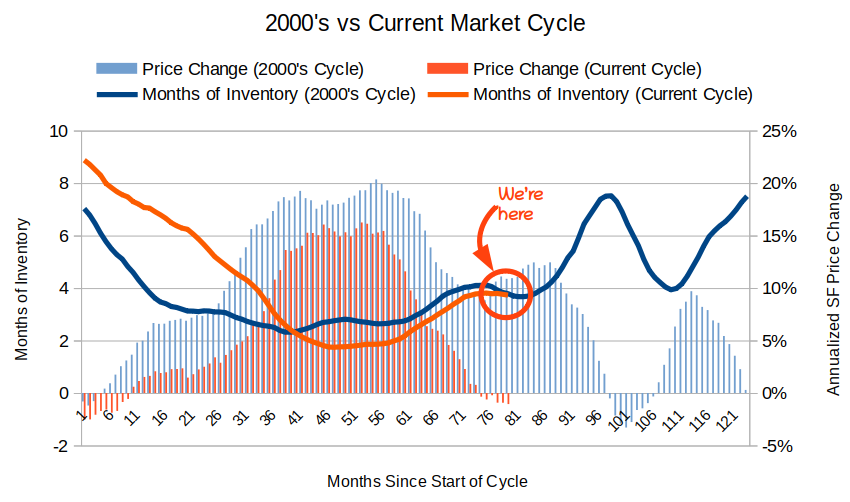
6.5 years since the market started heating up, we are exactly at the same spot in terms of months of inventory. I don’t think that’s any kind of rule, just an interesting coincidence and makes it easier to compare. In the 2000s cycle, prices were still rising at over 10% annually at the same months of inventory. It would take another 3.5 years before the market truly topped out.
Now I’m not saying things will end up the same as last time. We have the stress test which makes affordability tougher than it appears for anyone buying with a mortgage. Back then we had the financial crisis that threw the market for a loop and delayed the top. I doubt we are going back to crazy price increases, and I’m pretty confident that 2 years from the market will be weaker than it is now. But you can’t escape market conditions and unless they slide further, they are pointing towards price increases in the near term, so be warned.
Also weekly numbers, courtesy of the VREB.
| January 2020 |
Jan
2019
|
||||
|---|---|---|---|---|---|
| Wk 1 | Wk 2 | Wk 3 | Wk 4 | ||
| Sales | 17 | 75 | 171 | 329 | |
| New Listings | 94 | 331 | 493 | 897 | |
| Active Listings | 1794 | 1905 | 1907 | 2057 | |
| Sales to New Listings | 18% | 23% | 35% | 37% | |
| Sales Projection | — | 300 | 355 | ||
| Months of Inventory | 6.3 | ||||
As I thought last week, the slow start to the month was not to last. Sales were up and are now running 8% ahead of last year’s pace for the month to date. Not a huge increase but approximately consistent with the pattern we’ve been seeing for the last few months. New listings are on pace with last year, while inventory is unchanged.
New post + monday number: https://househuntvictoria.ca/2020/01/27/are-we-out-of-the-rental-crisis-yet/
In Ont, there are more townhouses that don’t have strata (called “freehold” townhouse) than those do (called “condo” townhouse). Don’t understand why we don’t have more (or any) of real freehold townhouses here in Victoria?
Numbeo compares 90 sq meter (968 sq ft) apartments, which are plentiful in most cities including Victoria.
https://www.numbeo.com/property-investment/indicators_explained.jsp
It makes sense on paper but doesn’t reflect what is actually available to buy in many cases which makes the comparison academic
Yeah would love to know why that is. Townhouses would be a lot more attractive to people if they didn’t come with strata
Small homes are available in real life. Especially the 60%(and growing % ) of homes that are condos/apt/townhouses. For example, these condos for under $300k. http://www.vicrealestate.ca/all-victoria-condos-for-sale/200000-300000/
To compare prices in two different countries (or cities), we should compare buying the same sized home (and for SFH on the same sized lot). That is no different from comparing buying two homes in the same city, the bigger one will typically cost more. For example, if you find that a big Canadian home costs more than a small UK home you can’t conclude that Canadian house prices are higher than UK – you should compare similar sized homes/lots, as most house indexes do.
But you would still have side clearance requirements which eat up lot space.
Right. What most makes the most sense is freehold townhouses where you own the lot up to the middle of the outside wall. For some reason they are uncommon in BC, where you generally get strata townhouses with the associated politics and fees. Freehold townhouses and duplexes are common in Ontario though.
So to get smaller Detached homes we need smaller lots?
True that townhouses make more sense though
Further to my previous post, it’s more the other way around – houses are large because they are expensive.
Developers don’t build small houses on detached lots today because it would underutilize the allowable floor space on the lot, and the lot accounts for a very high proportion of the selling price in markets like Victoria. They would still have to sell for close to the price of a bigger house and very few buyers would be willing to pay that for a small house.
What gets built today is townhouses, which provide less floor space without underutilizing the lot.
It may be clever but just like quality adjustment it makes the result essentially useless. If the smaller product isn’t available then it doesn’t help anyone that the houses are expensive because they are large. It’s not like there are many 1200sqft homes available for cheap that someone can buy if they can’t afford a standard 2500 sqft new build.
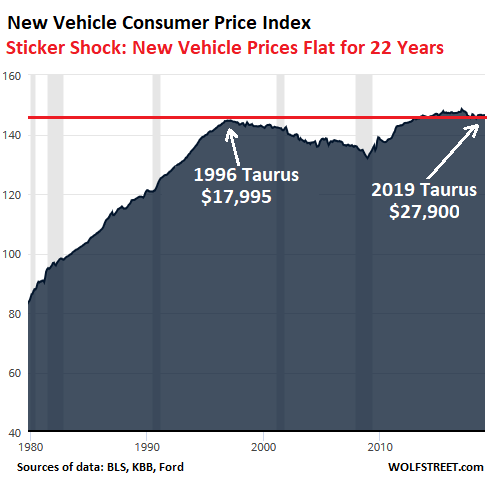
Same with the nonsense quality adjustment of vehicles and other goods. The government says vehicle prices haven’t increased because quality and features have gone up. However that finding is only useful in real life if the 1996 Taurus was still available to buy. But it isn’t, so in fact prices are way up.
There’s an important point about house affordability that isn’t mentioned much. Namely average home size. Canada appears to some to have high home prices compared to other countries, but that’s largely due to the large size of Canadian homes compared to other countries. Canada home size is 72 square meters per person. That’s more than double the size of other countries like UK (33 sq m), Japan (35), Italy (31), Spain (35).
Home size by country… (square meters per person)
Canada home size is so big because that’s what we can afford. People in those countries like UK, Italy would like bigger homes, but can’t afford them. People in Canada who can’t afford an average home here could afford a smaller home in Canada. As population density in core of Canadian cities increases, our average home size is likely going to fall. This will appear to some as improving affordability, but only if they ignore that the homes are smaller. An example of this in Victoria is the rapid fall of detached SFH as a % of housing stock and rise of condos/apartments.
The numbeo data cleverly captures this by showing home prices by country that are standardized by size (same apartment size, regardless of country) so when numbeo lists price / income, Canada home prices are cheap compared to other countries based on this same size apartment. If a Canadian can’t afford a home, they can (and do) buy a smaller one. A better measure of Victoria home affordability over time would be based on price per square meter of homes, not price of a detached SFH.
People here that are waiting for average home prices to fall may get their wish, only to discover that is a smaller average home size. They could instead lower home prices themselves instantly by buying a smaller (cheaper) home.
As a renter Victoria is much less affordable than it used to be.
Comparing affordability to historical norms is much more useful. There are some national and global factors for sure but local factors dominate
Averaging the country with wildly disparate housing markets doesn’t really tell you anything.
Even on a city basis it doesn’t tell you much without also specifying ownership rate and housing type mix
When all countries are included, Canada has low prices compared to most countries. 17th lowest house prices (price/income) out of 104 countries. https://www.numbeo.com/property-investment/rankings_by_country.jsp
The economist annual survey actually looks at the world, but they don’t include every city, so Victoria is not on there:
https://www.economist.com/graphic-detail/2019/03/19/the-worlds-most-expensive-cities
Also in their survey Vancouver is 45th, so they obviously use completely different criteria. I think the economist uses the price to rent as a factor, not the price to own a house.
That BI article has Victoria, the least snowy place in Canada, pictured as a frozen wasteland.
Caveat Emptor said, “The same lame Demographia study year after year. Sigh.. Since when does the UK and a few of her former colonies = “the world”
Haha. Yes, apparently “the world” consists of 7 countries plus Hong Kong, and has for the decades that this has been printed and lapped up by media outlets who love these shocking headlines. And there are people that still wonder why mainstream media is not trusted for real estate news ?
The bigger news headlines should be about the apparent catastrophe that has annihilated Japan, Spain, France, Germany, Mexico, billions of people in China (except Hong Kong), etc, etc, etc off the face of the earth; indeed the overwhelmingly majority of the population of this planet.
I’m waiting for the same newspapers to publish headlines from my annual study that concludes that I’m the tallest person in the world. What I mean by “the world” isn’t important ; you’ll have to read my study. 😉
BTW the top page of the Demographia study lists Japan among its countries. Yet at a glance I don’t see Japan figures anywhere in the study. Am I missing something, or is the study still making amateur hour mistakes (at best) or intentional misrepresentations (at worst) in its 16th year of publication?
Greater Victoria real estate sales, prices expected to rise
Greater Victoria home prices (for all types of housing) will likely rise by 2.4% this year to an average of $705,000, Ogmundson said, predicting a continuing climb by 2.1% next year.
https://www.timescolonist.com/business/greater-victoria-real-estate-sales-prices-expected-to-rise-1.24060059
Just went to book 10 condo showings for the weekend under 500k and 8 have accepted offers.
Sure, Victoria is a lot more expensive than Zurich, Nice or Geneva. Victoria is cheaper than the small town of Lugano in Switzerland.
Any truth to the rumour that Harry and Megan are moving into a condo in the Jukebox?
What happened out there? it is not raining and there is this patch of blue something in the sky.
The same lame Demographia study year after year. Sigh.. Since when does the UK and a few of her former colonies = “the world”
Victoria ranks number 11ty most expensive city in the world…
https://www.businessinsider.com/most-expensive-cities-to-live-in-2020-1
Thank you very much. Will be interesting to see how this goes especially with the + 1 million market not fairing as well.
That is generally one of the most active segments of the market. No shortage of demand for those prime places that are a step above the entry level that needs a lot of work. Very low listings in this segment.
Q4 2018: Avg inventory: 102 Avg sales: 31 MOI: 3.3
Q4 2019: Avg inventory: 68(!!) Avg Sales: 35 MOI: 1.95
How about 600k for just the carriage house, Barrister, assuming it too has full ocean views. Also one of the fireplaces and a couple bathrooms.
You can also just press ctrl-f5 to do a hard refresh.
Great post Leo. I’d love to see how SNLR and MOI vary according to price point and neighbourhood. An outfit in Van call Snapstats collate a stats package for the Van market. Link: https://gallery.mailchimp.com/35003784a53ed7fb42b391a69/files/3ff8b4cd-6868-486e-ad35-a49603aea1c8/MVR_2019_October_29_.pdf?fbclid=IwAR1jjYCIgcpjiE_UmVez6Mc7zCd3BYcjpKtoN0jEfdjSD-C83-2f-HbwREc
Basically it shows the upper 40%-50% priced segment of the market is stagnant (<10% sales ratio) although it seems that is changing recently. Does your analysis hold true if the high end sellers begin to significantly reduce prices?
I cleared my browser’s cache and it fixed the issue for me.
I always keep Leo’s last e-mail update and don’t delete til the next one. I click on the comments there and it goes right to the most recent comments. I find this is the best way to access this blog.
Leo, do you have that breakdown for SFH in the $800k to $1 million mark in the core or is that a bridge too far?
If you’ve already provided my bad… will search through the threads.
Bank of Canada holds interest rates, opens door to possible cut
[January 22] https://business.financialpost.com/pmn/business-pmn/bank-of-canada-holds-interest-rates-opens-door-to-possible-cut
That price range similar to the detached market is still pretty weak. I doubt you will see any price increases this year, possibly some price drops.
Prices roughly flat in a year but conditions have worsened for high end condos.
Q4 2018: Average of 103 listings and 14 sales/month. MOI: 7.4, Median days to sell: 35
Q4 2019: Average of 173 listings and 18 sales a month. MOI: 9.6, Median days to sell: 42
House hoarder!
An infuriating thread on the typical NIMBY nonsense in Vancouver (same thing here). Sanity prevails in the end though.
https://twitter.com/pwaldkirch/status/1219810710034665473?s=21
Thanks. Not sure why caching is still causing problems. Seems like the only way to fix it is to disable all caches which makes it slow. Any wordpress wizards in the audience that could help? leo.spalteholz@gmail.com
I think #1 risk right now is the economy. Does not have to be a black swan event, just a run of the mill recession + some slower population growth would halt price growth and resume declines. We are well overdue for a recession, but could just as well hold for another year.
Mt. Stephen is a near 2,500 sq/ft 1999 build…difficult comparable to Asquith.
Asquith had suite and ready to move in. Only two bedroom upstairs with no interior staircase to basement but not chopped up as many homes are.
Inventory is already very low compared to historically norms but quality inventory is even more rare.
KennyG: You are absolutely right that you dont need a larger home. The only appeal for some is that it is the same price as 3000 sq ft on a 6500 square foot lot new build in Oak Bay. The wide full ocean views is what I suspect will sell the house. My guess is that some developer will buy it for the building lot potential which is sort of a shame. But we are leaving to live in a smaller town where my wife has a lot of family (good and bad I suspect). That is assuming that the renos actually get finished in my lifetime. We are already running six months behind with no end in sight.
I liked Asquith as well from the pics but a 100+ year old house can have a lot of issues. I’d prefer not to own a 1.2M house in Oaklands 🙂
Asquith is interesting. At first glance i thought it was crazy it went that quick for that price. But when you take a closer look you see that it is a large house, completely renovated (looks to be quality renos as well from the pics) and has a suite to boot. When compared to the recent sale of 2709 Mt. Stephen this doesn’t seem that out of place.
To me, and please let me know if I’m off the mark here, the reason it went in a multiple offer situation is probably because of the suite. That suite income bumps up people’s potential mortgage amount quite a bit I believe (100% of potential rental income can be used). That might put those with a lower budget sans suite now into the million dollar mark. I think if it didn’t have that suite it probably wouldn’t have gone in multiple offers.
My nowhere near on the ground thoughts on it anyway.
“KennyG: South facing large backyard (26,000 sq foot lot) ; full basement, 8000 sq foot house. Attached double car garage, two additional garage bays in the carriage house. 6 full baths, two 2 piece baths. Ten foot ceilings; all new electrical and plumbing. Three fireplaces, two gas and one
No idea about the school catchment. Five minute walk to Fairfield Plaza.
But why even think of moving if you are happy in the house that you are in?”
‘
‘
‘
Good God why would I want a 8000 sq foot home, I grew up in something like that, I think my generation, Gen X and later look at those homes and have almost zero interest in them, 3500 is more then enough, even 2500 sq feet is ok with the right layout, i’m a big fan of smaller homes.
I am happy where I am apart from the items I listed so move would have to be everything i’m looking for. The new homes in Oak Bay/Victoria have small lots and generally no basements and want $800 sq foot which doesn’t add up.
Bayview towers costs are primarily related to the polluted land, rumor has it that things are soo bad they have to ship the soil down to the good old USA which are going to be a very expensive % of the building cost. Also having affordable units alongside luxury suites does not bode well with clientele who have a high disposable income.
The way the year has started to my surprise I think Leo might be correct about upward price pressure but if I had to bet I am thinking the 700 to 900k condo market might be flat because spec tax, foreign buyer tax, etc., disproportionately impact this segment of the market.
X-factor is if market does see substantial gains and people start cashing out and downsizing into bigger condos.
Lack of new inventory will likely keep prices from decreasing. So many projects delayed like Bayview Tower 4 due to constructions costs and city bureaucracy. There just isn’t a glut of new condos coming to market.
On the ground I am seeing a crazy start to the year below the $1,000,000 mark. Asquith in the Oaklands area perfect example of lack of quality inventory. Listed for $960k and goes in multiple offers for $1 million.
James: My coffee had great appeal.
KennyG: South facing large backyard (26,000 sq foot lot) ; full basement, 8000 sq foot house. Attached double car garage, two additional garage bays in the carriage house. 6 full baths, two 2 piece baths. Ten foot ceilings; all new electrical and plumbing. Three fireplaces, two gas and one wood.
No idea about the school catchment. Five minute walk to Fairfield Plaza.
But why even think of moving if you are happy in the house that you are in?
” I will be putting up my house sometime this summer (assuming the renos on the new place stay on schedule) if you might be interested in a house on Rockland”.
Here are a few of my requirements, LOTS of sun, so South or West facing large private back yard, quiet street, walking distance to stores, prefer 2 car garage, no crawl space want full basement for gym, Oak Bay catchment, prefer not to have an income suite that I need to rip out. Pretty picky I know but were fairly happy where we are and I have never had pay realtor fees so i don’t want to ever move again. Problems with Rockland is no parks for kids among other things.
If you house meets most of these requirements then maybe we can talk.
lol. @Barrister, in fairness, I hear you make great coffee.
Barrister – 601K over here.
Barrista – I can give you 600k for it!
Excellent analysis Leo.
I’m interested in what to expect from the condo market early this year, but have trouble differentiating the condos I’m interested in ($700k+) vs what seems to make up a lot of the inventory ($500k-). Those two buyer groups are very different, and must be acting differently. Do you see $700k-$900k condos increasing in price this year?
Kenny G. I will be putting up my house sometime this summer (assuming the renos on the new place stay on schedule) if you might be interested in a house on Rockland.
Leo what introvert is saying is true – if you just come to the main page you see the old thread of ‘out of town buyers’ and i have to reload the page to get it to show the new thread. just FYI.
Good post Leo. Your analysis is thorough and from my personal experience with RE, there are 3 things that will reduce prices.
1/ MOI is greater than 12, most people won’t wait that long to sell (e.g. Victoria luxury properties)
2/ further government intervention to reduce demand (e.g. restrict buying 2nd properties)
3/ and finally the Black Swan event(s)
The most likely IMHO is 3/. There is so much geo-political BS, climate change, and macro risks to sink the world economy.
Now if that doesn’t happen, then expect price acceleration as per your graphs.
Unclear what the confusion is here. In the first chart the green line is 12 month average MOI, and the red and blue arrows are clearly just annotations to show the bigger trend. Note I’m not saying that this is a hard and fast rule, but if you look at other measures where we have more data (affordability for example) you see the same cycles.
Right, top end market is still weak. Lower end may very well increase while top end continues to decline so total market can compress to a certain extent.
I think what finally topped the market in 2008 was affordability. It got so stretched that local incomes couldn’t afford to buy anymore, so they didn’t. However then the financial crisis hit and interest rates dropped through the floor suddenly prices looked attractive again so they roared up again to 2010. Without interest rates decreasing it wouldn’t have happened so I suspect the market would have drifted downwards from 2008 levels.
Well it should be clear from the small numbers of declared vacant homes (e.g. 900 in Greater Victoria ) that the spec tax isn’t going to be a big tool to solve the vacancy problem, and the govt can now focus on things that could solve it, such as incentives to build more homes. For example, the G & M article linked below talked about falling new BC home construction numbers, they could start by fixing that.
LeoS drew those blue line MOI goalposts on the “MOI Victoria cycles chart”, and declared a 9 year long MOI “cooling cycle”, not me.
If the blue lines aren’t “smoothed” MOI, what are they?
Always have to compare it to what would have been without it which might be much less.
Not saying the spec tax necessarily added a lot of inventory because I’m somewhat suspicious of the “rental universe” numbers that CMHC puts out. Purpose built rental is one thing (even there there are strange numbers in the data) but I don’t see how they can get an accurate count of the number of rental units on the private market,
It’s unlikely that many of those 3,000 are because of the vacancy tax. The City of Vancouver has been collecting its own vacancy tax since 2017, and has found only 2K vacant homes to begin with.
It’s hard to consider the spec tax a success when rental vacancy rates haven’t improved, and number of vacant homes is small to begin with and hasn’t fallen much.
Leo, not sure if it’s just me, but I’m not seeing this new thread on the main page. I’m getting here by navigating to the link you posted on the previous thread.
Policies aimed at forcing condo investors to rent out their apartments in Vancouver are working, report suggests
“The region saw an unprecedented 11,000-plus condos come into the rental market in the past year, according to Canada Mortgage and Housing Corporation’s annual report released last week.
That far exceeds the approximately 9,000 newly built apartments, meaning a minimum of 2,000 older condos were added to the rental stock. Nothing remotely similar happened last year, when about 1,000 condos were lost from the rental market.
The numbers were even more noticeable in downtown Vancouver, where nearly 3,000 condo units were added to the rental market, but only 300 new units had been built.”
Which aren’t MOI. The green line is. If you’re going to try to move the goalposts, at least leave them on the field.
I’m referring to the blue straight lines that LeoS identified as the long cycle, as I’m assuming he doesn’t include the “wiggle” as he calls it. Because if we do include the wiggle, that creates two short cycles, messing up the long cycle idea, and implying that MOI can do whatever it wants, and doesn’t need to follow a long cycle. Even following the wiggle, it took 2.5 years to get from MOI=3.8 (2006.5) to MOI>7 (2009), a long time to wait.
You can see plain as day it went past 7 and into 8 in late 2008/ early 2009. They dropped the interest rate from 4.5 to .25 to try to correct that.
In Leo’s market cycle graph, you’ve about 10 months of mild increases before the precipitous drop off.
Fairly early in the year but trend I am already seeing is a ton of buyer files (500k-1000k) on my desk but not much inventory to look at especially in terms of quality inventory (SFHS that are not chopped up, etc.).
“Anyone here planning to wait that long?”
I may be looking to move up to a so called luxury house >2MM house from a more modest house around 1.5MM that was more of a starter home when purchased back in 2001, kids now need more room, interested to watch the higher end market fall/stagnant while stock market did 20-30% percent last year, I know a few people here sold their portfolio early last year and are most likely kicking themselves now for trying to time the market.
Thanks, Captain! I’ll consider myself warned! Warned that my net worth might increase (some more) above and beyond mortgage principal pay down.
Months of Inventory. Sorry didn’t label
What is the 0-10 on the Victoria Market Cycles actually represent?
Great post.
On your graph it took 4 years for the MOI to cool from 4 to 7 (2007-2011). If that holds this time, if we need to wait until MOI>7 for falling prices, we shouldn’t expect falling prices for about 4 years (2024). Anyone here planning to wait that long?
Fantastic writeup.
Sounds like no bargains anytime soon.