
Nov 27 Market Update
Weekly sales numbers courtesy of the VREB.
| Nov 2017 |
Nov
2016
|
||||
|---|---|---|---|---|---|
| Wk 1 | Wk 2 | Wk 3 | Wk 4 | ||
| Unconditional Sales | 83 | 241 | 408 | 574 | 599 |
| New Listings | 157 | 387 | 553 | 733 | 786 |
| Active Listings | 1909 | 1916 | 1855 | 1813 | 1815 |
| Sales to New Listings | 53% | 62% | 74% | 78% | 76% |
| Sales Projection | — | 610 | 664 | 676 | |
| Months of Inventory | 3.0 | ||||
This month is finishing very strong. Even backing out the 40 some sales that happened months ago but were reported in November, we have a 5% increase over last year’s sales rate. Every week has accelerated the sales pace comparative to the same week last year. Could be random, but I believe a significant number of sales are being pulled forward before the stress test.
A point of discussion in the comments on the last post is how much wealth there is Canada, and whether incomes matter as much as I think. I’ve long maintained that affordability measures have been the most predictive in terms of where prices will be going in the next few years but many people have alternate theories that rely more on wealth than incomes. After all, Victoria is a retirement and vacation destination and many people buying are surely not deriving their income from local sources.
This is reflected in the statistics (note: from REALTOR® survey after transaction so not necessarily complete data) of who is buying and how they are financing the purchase. Only about 20% of our buyers are first timers, while I have heard figures of up to 50% in other markets. Another clue we have a lot of either vacation homes (or speculators) is that a massive 20% of sales are to people buying a second home. That means about 2000 of the 10,000 sales last year went to people buying a second (or third or fourth) home! Seems crazy high.
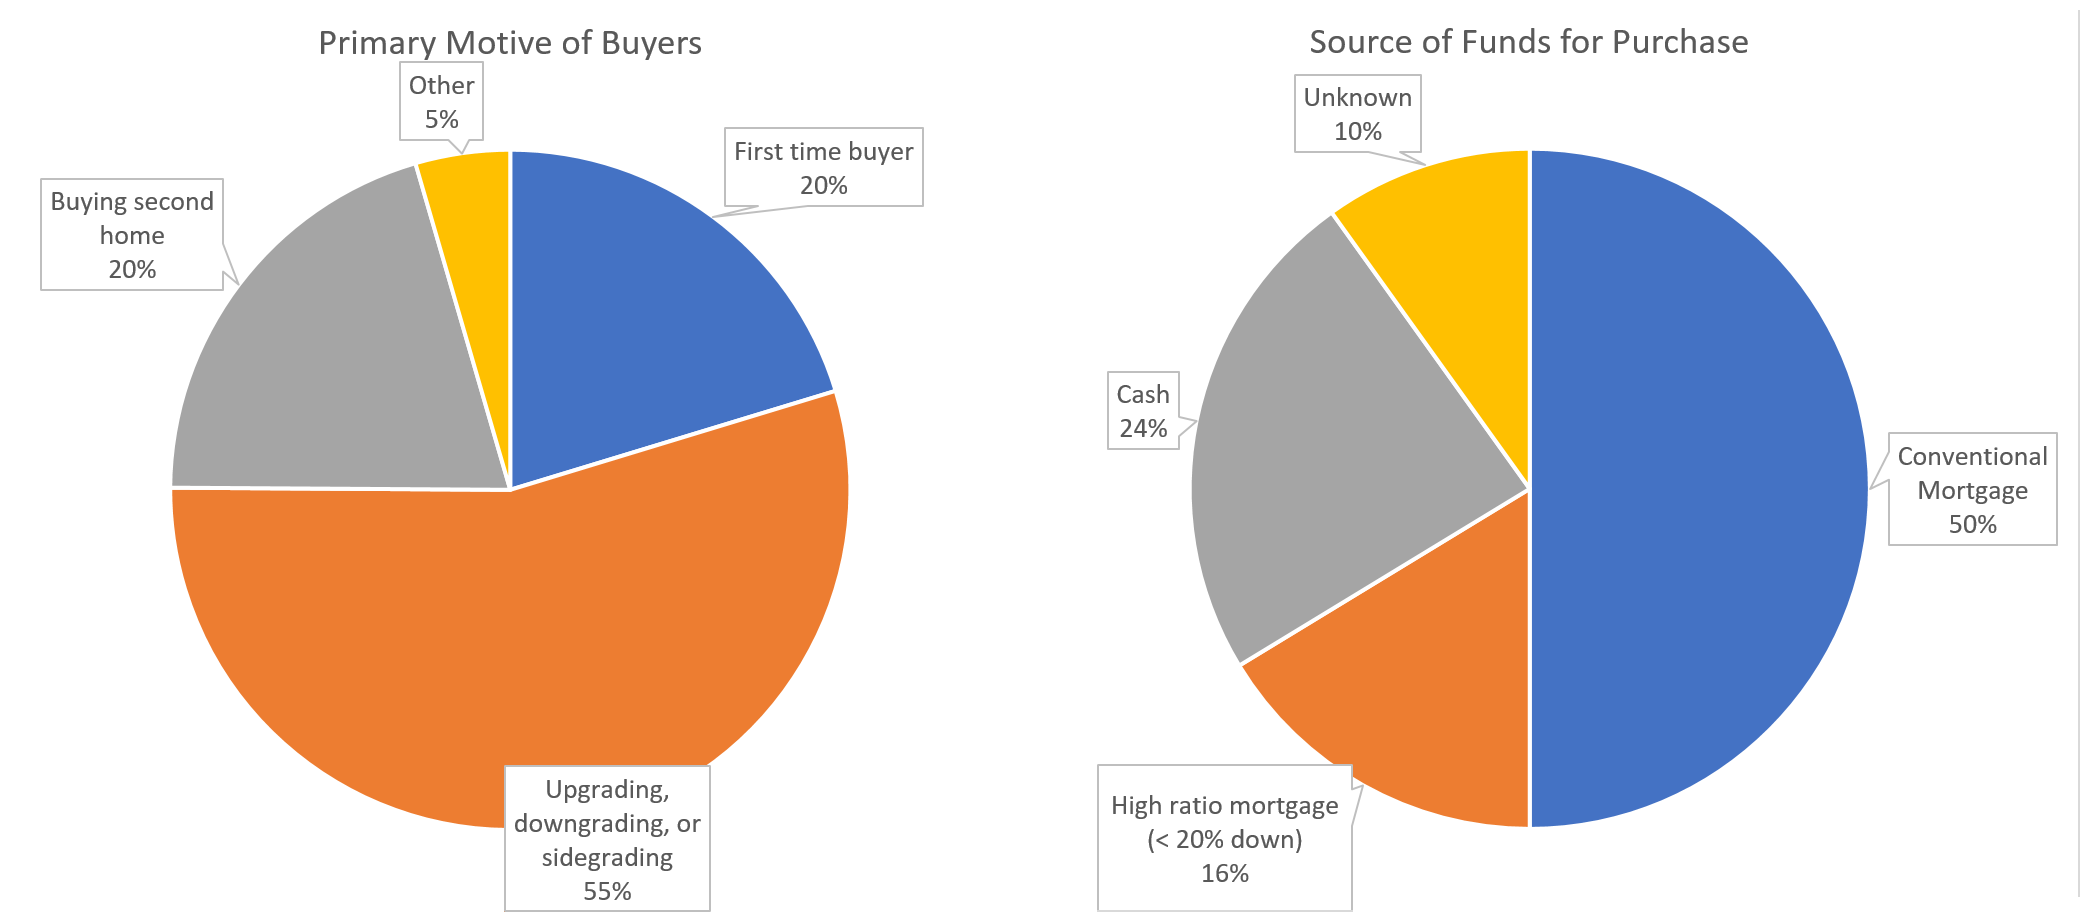
Despite this, there isn’t quite so much money floating around that the majority of people are paying cash. 70% of buyers are using a mortgage, be it high ratio (20%) or low ratio (50%). And how big are those mortgages? Quite sizable according to the Department of Finance Financial System Review which measures the percentage of new mortgages where the loan is more than 4.5 times the applicant’s gross income.
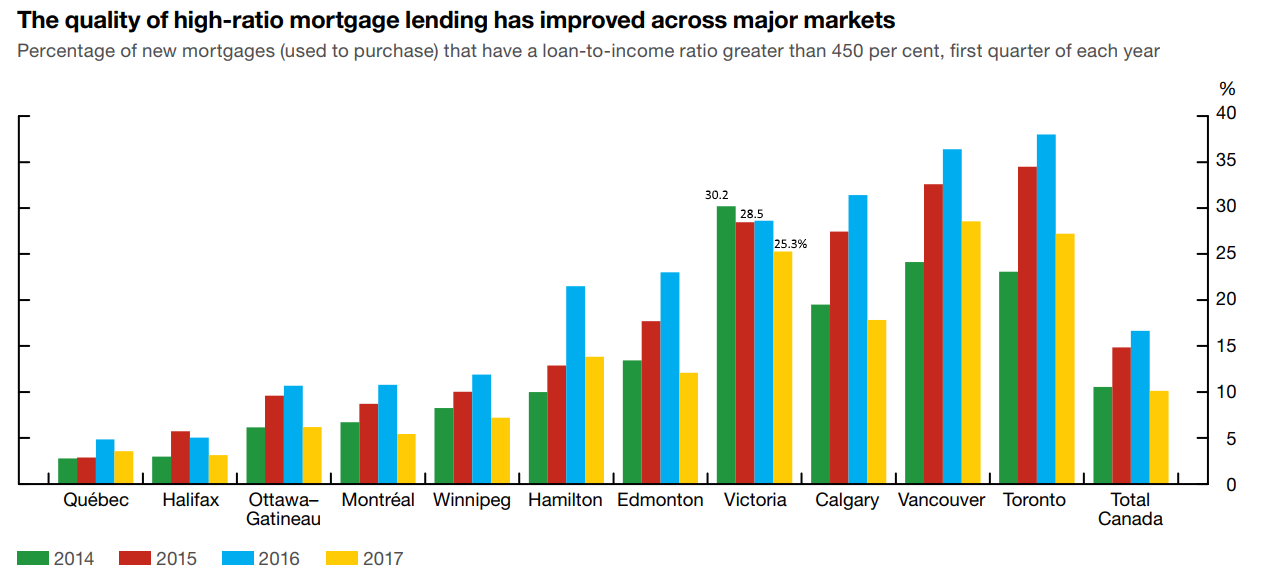 This graph tells me a few things and raises some questions:
- Victoria is just as debt dependent as the higher priced markets of Vancouver and Toronto.
- Victoria had by far the highest ratio of high-ratio mortgage lending in 2014 and then the percentage declined/flatlined in 2015 and 2016 while it increased in every other city. Any theories why that could be?
- The percentage of high-ratio mortgages dropped in 2017 in every city. This is almost certainly because of the stress test on high-ratio mortgages that was introduced last fall. It gives us a clue that the coming stress test in January will not pass unnoticed. After all, if a stress test affecting 20% of buyers caused a substantial drop in marginal buyers, then one affecting 2.5 times as many people will hit harder.
- What does it mean that high ratio mortgages declined? Prices here didn’t drop, so either those marginal buyers did not buy at all (could be one reason sales are down a bit in 2017) or they were failing the stress test so they somehow came up with extra money to transform their mortgage into a low-ratio one.
- This data gets us closer to figuring out whether people are stretched to the edge with debt, or comfortably making their payments. Given that RBC was deemed too big to fail, I think we as taxpayers should demand complete statistics on the incomes and debt levels of Canadian home buyers by region from the big banks. OSFI: how about that as your next project?
I wonder what will happen when China’s bubble does burst. The question is…. will they flood out of China or will they be forced to sell their properties overseas in order to cover their debts in China that are collapsing? I don’t know if anyone knows the answer to that question.
The other looming question for me is what happens when Vancouver starts to collapse? Will people hold onto their house and watch hundreds of thousands of dollars in equity evaproate, or will they sell as quickly as they can to protect what they have made over the past few years? If they do sell,( which seems logical) , then where will they move to? Places like Victoria or Kelowna etc seem a likely bet. So will Victoria prices surge even as Vancouver plunges? How could it not if the demand is coming? A three million dollar broken down bungalow on the west side of Vancouver (Kitsilano for example) will buy a beautiful, well sought after house here in the core of Victoria, and still allow them to put a million dollars plus in the bank.
Thanks Mike. Lots of good info in the new financial system review on that front. That family gifting is going to have to crank up if people want to overcome the new stress test and still buy.
New post: https://househuntvictoria.ca/2017/11/28/rents-launching-upwards-in-victoria
The business cycle is on borrowed time. Daily household debts are being paid via HELOC’s.
New borrowers are the sacrificial lambs at the mercy of the borrowers from last few years who couldnt control themselves. Negative equity will be the 2018 catch phrase.
2018 could be a ‘scary year’ as housing correction puts some debt-ridden Canadians under water
“Terrio, president at DebtSavvy.ca, said a 40 per cent surge in home equity lines of credit since 2011 has helped mask a credit crisis created by consumers who tap their home equity to pay their bills.
“The insolvency business is cyclical, and the last five-year peak was in 2009,” said Terrio. “We’re now into the eighth year of a 5-year cycle because of people’s equity in their homes and low interest rates.”
“I think 2018 is going to be a scary year,” said Douglas Hoyes, an insolvency trustee in Toronto.”
http://business.financialpost.com/real-estate/crunch-looms-as-house-correction-puts-some-canadians-under-water
Great post Leo –
One thought on the decrease of high ratio mortgages.
After premiums were increased dramatically in March 2017, I noticed significantly more ‘high ratio aversion’ from my clients. Most however still qualified under the insurable standards to (to get the a better rate).
Family gifting seems consistent in it’s strong support to avoid high ratio insurance premiums. I feel this played a much larger role post March 2017.
Hmm. Must be on the server side. I’ll tell the server people. Weird it only happens with Safari.
https://twitter.com/j_mcelroy/status/935585466669187072
I only get the problem with this site and I remove all cookies and data daily. Thanks for the help, any other suggestions?
Good to see all the millineal comments on CHEK’s Facebook post on the stress tests. Positive to see so many get it that rising rates with stress tests should force prices down as buyers get pushed out and it’s best to rent right now. There is hope afterall. 🙂
What’s with all the Golden Head pervs? Is it something in the water out there ?
http://www.saanichpolice.ca/index.php/media-releases/1230-woman-grabbed-in-gordon-head
Deb:
I suspect that the time for a “little” restraint is long past due and it is time for a lot of restraint.
Deb: Can you try going into Safari -> Preferences -> Privacy -> Click Details under the “Remove all website data” button and remove the data for househuntvictoria.ca? Might fix your issue.
https://www.igorkromin.net/index.php/2014/11/27/how-to-fix-safari-cant-open-the-page-error/
Hmm. Do you get that same error on other pages or just when posting a comment?
Sorry tried to delete this repeat posting but unable to get rid of it. For some reason when I post Safari indicates that it is unable to reach the server. When I go back into HHV the posting is there but I can not edit it:(
I hate to be a Christmas grinch but perhaps it is time for a little restraint!
http://www.cbc.ca/news/politics/bank-of-canada-household-debt-1.4422623
True, but it’s kind of BS data collection is it not? “First home” and “second home” aren’t motives, they’re incidentals. “Rent avoidance” and “Investment” are motives. Also upgrading, sidegrading and downgrading tell very different narratives and yet they lumped them all together. I’m under the impression that these categories were slapped together by an amateur. Or a middle school student 5 mins before class perhaps.
New CMHC rental report out as well. Vacancy rate up a bit to 0.7% but rents are rising quickly. https://www.cmhc-schl.gc.ca/odpub/esub/64471/64471_2017_A01.pdf?fr=1511883307944 Full article on this tonight.
Updated BOC Financial System Review published:
https://www.bankofcanada.ca/wp-content/uploads/2017/11/fsr-november2017.pdf
Related – CBC article:
Almost half of new, young homeowners have down payments of less than 20%
That’s one of the main takeaways from the Bank of Canada’s semi-annual Financial System Review, published Tuesday, which lays out the central bank’s views on the biggest risks facing Canada’s economy.
Overall, less than one third of all homeowners are so-called high-ratio borrowers — the banking terminology for people who own less than 20 per cent of the bank-appraised value of their home.
Forty-nine per cent of homeowners 35 or younger had to pay for mortgage insurance because their down payments were small, the Bank of Canada said Tuesday. But the central bank says almost half (49 per cent) of homeowners 35 and under who bought a house during that two-year window were high-ratio borrowers.
Recent mortgage rule changes have taken aim at this segment of the market for exactly this reason. But new rules set to be implemented in early 2018 will also tighten conditions on the other side of the market, for people with large enough down payments that they don’t have to buy mortgage insurance.
http://www.cbc.ca/news/business/bank-of-canada-financial-system-review-1.4422740
Agree Leo. The cool kids have to go somewhere. Perhaps Halifax is cooler than Duncan. Has a better name for one thing…
I love the whole concept of Bitcoin. It’s counter culture finance. A perfect illustration that the system we all buy into is also faith based and a new faith might uproot it. Never was gutsy enough to invest in it. Certainly not now….
If I had to pick a town to invest in, it would likely be Halifax. The start of a tech boom, average house price around $330,000, lots of room for upside.
https://www.thestar.com/news/canada/2017/07/03/halifax-becoming-boom-town-as-it-welcomes-population-economic-growth.html
Paradoxically, it worries me that this will force more money overseas.
Certainly.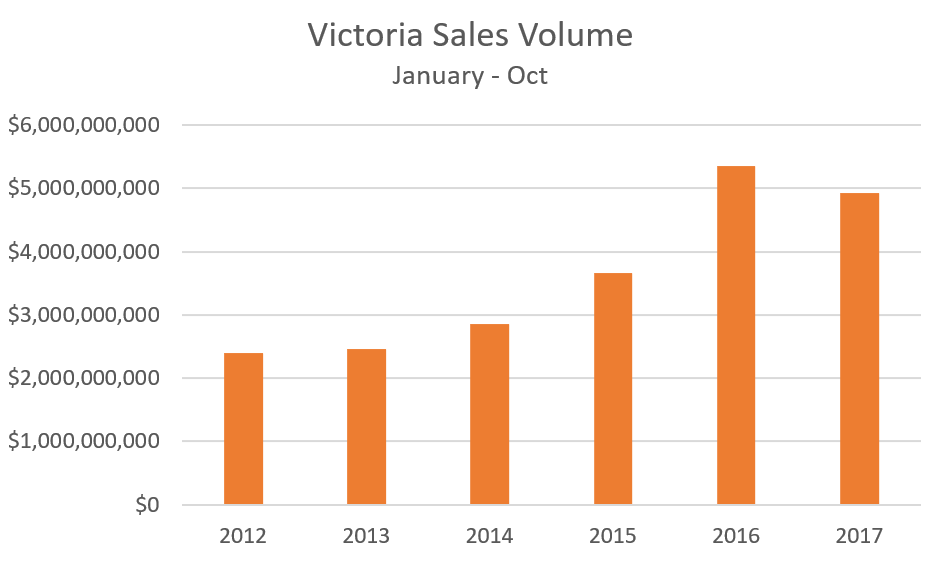
Sales volume down a bit, but November will outpace last year, and if it continues then we may very well improve on 2016 despite significantly fewer sales.
Leo how do you embed a image?
Just thought I would throw this one out there. It looks like bitcoin will hit $10k by the end of this evening.

After 100,000 people signed up to trade bitcoin on a single exchange server after chatting over some turkey in the US last weekend.
Article: https://www.cnbc.com/2017/11/25/bitcoin-tops-8700-to-record-high-as-coinbase-adds-100000-users.html
Could be. It does presume an unusual level of financial savviness in the general population though.
I would imagine “second home” includes investment properties.
I can’t imagine that lending criteria in Victoria are significantly different from somewhere else. Or what are you thinking?
This was pretty funny: https://www.theglobeandmail.com/opinion/come-to-vancouver-its-right-as-rain/article37084723/
Have you guys read this http://vancitycondoguide.com/dollars-spent-vancouver-real-estate/
Leo do you have charts showing the same type of statistics for Victoria in terms of sales volumes year over year?
StatsCan has its own listing data for dwellings and they periodically send people to field to update it for accurate stats collection, they also update the listing based on other survey results, not just census. So most suites in Gordon Head and other areas are covered, even those that have not been used for years, as long as the structure is still there. This has nothing to do with if owners have declared them to city or CRA (and they don’t share the data with city or CRA either)
China choking back the mortgage money and tighter lending rules may free up those hoarders in Golden Head if things go south over there.
They can ban non-resident buyers, it’s time we do.
How China’s Going to Try to Control Its Massive Housing Bubble
“An array of city-by-city curbs includes bans on buyers reselling for multiple years; mortgage restrictions; increased down-payment requirements; bans on purchases by non-residents; and limits on the number of homes that people can buy.”
https://www.bloomberg.com/news/articles/2017-11-27/china-s-war-on-bubbles-means-homes-sales-set-to-fall-in-2018
Interesting Freedom. Thanks. This explains things for Gordon Head. However, I imagine most suites are not declared so that stat could be higher esp in other areas. Does explain the empty condo situation in certain areas though.
“haunted” house in the census doesn’t necessarily mean no people live there.
The census measures not vacant homes per se, but the number of units (note that a basement suite is counted as a SEPARATE unit from the main house) that are not occupied by the usual residents during census period. These include units occupied by non-permanent residents, such as an out province student who goes back home during the summer, or a rental unit between occupants, or a secondary residence.
That would explain the high number of “haunted” houses in Gordon Head area, as there are so many rental basement suites and houses occupied by students.
I listen to those in the trenches seeing what is happening now. Victoria bankruptcies are spiking along with foreclosures from a few months ago when I saw very few.
This is from back in March in Ontario when their prices began to tank:
“I’m seeing more and more millennials. It’s a substantial increase. Every time you see a millennial walk into your office – it’s disturbing. Many are homeowners seeking solutions to their debt woes.” – Rob Kilner, licensed insolvency trustee.
https://www.theglobeandmail.com/globe-investor/personal-finance/genymoney/millennial-home-buying-could-lead-to-insolvencies/article34173773/
Luke
interesting maps – thanks
No surprise that there are a lot of haunted houses in the Songhees strip of Vic West. Feels like a ghost town there.
Likely a lot of the “empty homes” are condos, but there are empty houses in Fairfield Rockland and South Oak Bay. Holiday homes/vacation rentals and presumably also some that just avoided filling out the census.
“Also confirms my buddy’s credit counsellor friend claims of 70% of Victoria borrowers are living on the edge.
No it doesn’t. ”
I’ll take a credit counsellor’s word over an anonymous lawyer who had to retire at 40.
Barrister – the stat’s come from the 2016 census so I’d think they were pretty accurate. Includes all types of housing – including condo’s – so maybe there’s a disproportionate amount of empty condo’s in your hood?
Luke: You stat for haunted houses would mean that one in fourteen houses in Rockland are empty. I have gotten to know the neighborhood pretty well and I cant think of an empty house that I know of offhand. I am going to take a closer look when I am up to taking my walks again. I wonder how they came up with this stat?
Census mapper has just released some new data from the 2016 census, though some old data from 2006 or 2011 remain, much has been updated.
We can view many new data sets, such as data from under 39 year olds still living at home (locally highest in Cordova Bay, Uplands, and South OB – but virtually non existent near downtown)
https://censusmapper.ca/maps/928?index=1#10/48.5352/-123.3710
Ethnicity (locally highest in Gordon Head and lowest in South OB/Fairfield), etc.
https://censusmapper.ca/maps/902?index=1#10/48.5207/-123.4396
For local affordability we can see Vancouver has a lot of ‘red’ compared to Victoria:
https://censusmapper.ca/maps/897#10/48.6243/-123.2309
Low incomes Explorer:
https://censusmapper.ca/maps/844?index=1#11/48.4390/-123.4273
For Barrister: ‘Haunted houses’ which is empty homes, gives us a view of how many homes in each specific part of Victoria or elsewhere are empty… in my part of OB it is 4.4%, for Rockland it’s 7.2%.
Victoria has the highest proportion of ‘haunted homes’ downtown or in VicWest, but interestingly – also in Gordon Head.
Vancouver’s ‘average’ however, is predictably higher at 8.2%. Pockets of Haunted houses high in Van include Richmond, UBC, Coal Harbour/downtown and it’s quite high across the west and south sides.
https://censusmapper.ca/maps/870#12/48.4505/-123.3590
Unfortunately, I couldn’t find any data on debts or mortgages to be broken down by the mapper – this would be very telling info for our curiosity around local debt (maybe you can?). Click on the links under ‘Browse more maps’ to view more data, you can even see ‘Trick or Treat’ density!
No it doesn’t. Given that only 16% of purchasers have a high ratio mortgage and the loan to income ratio is declining over time best you can get for the doom and gloom scenario is a small percentage of homeowners who bought with a small down payment within the last couple of years might be at risk of negative equity if prices fall. A slightly larger percentage might be at risk if interest rates rise further.
Leo, I wonder if the decline in high ratio mortgages has something to do with local lending criteria?
I be interested to know what the breakdown between SFH and condos are in the sales number.
Josh: Asking people their motive for buying is likely to piss them off to start. I am surprised that they are able to even put down whether it is a second home. In Victoria, I dont think that there are a lot of empty houses so while some of these properties are investment houses they add to the rental stock in the city.
I don’t think the issue is so much about the quality of mortgagees as it is about the number of mortgages itself. I don’t think you can interpret the data beyond the fact that there was a marked increase that has presumably held steady since 2014. Each mortgage is on a property that came out of the inventory. Was there an equivalent increase in buyers each purchasing one home? Or was there a small increase in buyers but each purchasing multiple homes? If it is the former, low inventories would point to a supply problem. If it is the latter, low inventories point to land banking (AKA hoarding). The solutions to each problem would be quite different.
Who’s bright idea was it to collect data on what the motive for buying was and not including “investment”?
I find it a little hard to keep my eye on the ball on this one.
But this is what I see. For example: A person sells a broken down bungalow house in Kitsilano for three million dollars. They come to Victoria and can decide to pay cash and buy one house and bank the huge balance of their money. Or they can decide to buy three houses using up all their money from the sale of their bungalow in Vancouver.
Or….they can bank some of their money and take a mortgage out on the houses that they decide to buy in Victoria. If they flood each house with a “hefty” downpayment from their Vancouver sale, they get punished by having to pay a higher interest rate because it’s the higher ratio mortgages that qualify for the government insured mortgage which then allows you to get the the lower interest rate because their is less risk for the bank because it is insured.
So…..in a sense wouldn’t the charts showing the higher ratio mortgages be meaningless because it’s hard to tell who is really just not able to put down more of a downpayment and who is simply not doing that in order to qualify for the lower interest payment. (So it end up “looking ” like people are not able to put down much of a downpayment when in fact they can.)
It seems that you are a mug to put down too much when buying a house because you don’t get the lower interest rate. It’s almost like you are being encouraged to spread your wealth around and lean towards more debt.
I alluded to this in the last post. Victoria is the anomaly. While all other cities showed proportional increases and decreases, the number of high ratio mortgages across these dates is probably constant in Victoria (I doubt that year by year decline is significant). However, the difference in the number of high ratio loans given out in Victoria in 2014 is likely significantly higher than the average of all the high ratio loans given out across all cities per capita. This is very weird data. We could be a random outlier. It could be a data entry or reporting error. Or, something happened in 2014 that was specific to this city that spurred high ratio mortgage lending by the big banks. A change in qualification criteria? Bundled mortgages? Foreign student mortgages? Sudden influx of population?
“Victoria is just as debt dependent as the higher priced markets of Vancouver and Toronto.”
Great post Leo. Goes to show that all the talk of bags of money controlling this town at all levels is all bullshit just because they hang with rich people or live in a higher end hood. Also confirms my buddy’s credit counsellor friend claims of 70% of Victoria borrowers are living on the edge. The debt bomb is real and vulnerable to a real shock if just one of the global wheels fall off.