Which municipalities appreciate the most?
Let’s just say up front I appreciate all municipalities equally…
But are some places better bets than others for home appreciation? If you’re buying for maximum return should you buy a house in Esquimalt or Oak Bay, or does it even matter? Are you better off buying in Greater Victoria or are island properties appreciating faster? Let’s take a quick look.
There’s many ways to measure prices, but medians and averages aren’t really useful here because they are influenced by the changing mix in housing over time. What we need in order to measure house price appreciation is a repeat sale index. On that front we only have two options: Teranet or the MLS home price indices. While they aren’t identical and you’ll need a PhD in math to understand the methodology in detail, they fundamentally measure the change in house prices by analyzing sales pairs (the same place selling twice) over time. Teranet goes back to 1990 and it’s independently produced from the real estate industry so in general I prefer it, but it only goes down to the level of Greater Victoria so it’s of no use in this case. That leaves us the MLS HPI, which goes back to 2005. Nevertheless we are on the eve of 2020 so 15 years of data is nothing to sneeze at either.
Using the MLS HPI, we can look at total appreciation from 2005 to 2019, and then calculate the annualized rate of appreciation by municipality.
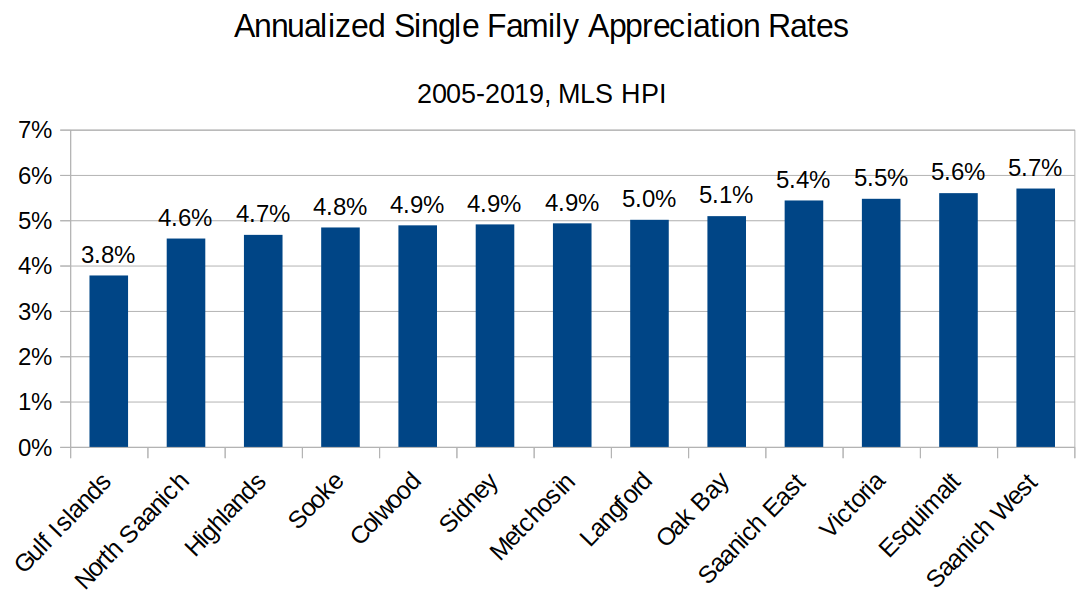
As you can see, appreciation rates are broadly similar between different municipalities in the region. Although there are small differences, the error on the data is approximately ±0.25% so there’s likely no real difference between Victoria, Saanich East, Victoria, or Oak Bay for example. However a few things to note:
- Gulf islands is a clear outlier on the low end at 3.8% annual appreciation. It stands to reason that a region where many places are want to haves rather than must haves does not have the same demand pressures.
- Areas further out may appreciate less. North Saanich, Sooke, Sidney, and Langford are all on the (slightly) lower end and all further from the core.
- Up and coming areas may appreciate more. Places like Saanich West and Esquimalt top the list (Vic West was highest but the data was noisy due to low sales). These areas have developed and changed more than the static areas like North Saanich or Oak Bay which likely aren’t gentrifying much at this point.
Because of the very small difference in appreciation rates, I don’t think we can be overly confident in the second and third points. I believe there is a small factor at work, but realistically these data illustrate how connected real estate in the city is. A house in Oak Bay fundamentally provides the same utility as one in Saanich, so it is no surprise that no neighbourhood can get very far away from the others.
If we had more data we would also see that the order of municipalities in that chart would change over time. Prices in some areas are higher than others, so it’s clear that if we could look at price history since Victoria was founded, the higher priced areas would have appreciated the most. However as they say in the prospectus(es?): past performance does not guarantee future results.
I can still remember when my cousin bought his condo in Victoria and bragged about how cheap it was; guessing those days are gone now.
Thanks!
Monday numbers: https://househuntvictoria.ca/2019/12/23/dec-23-market-update/
Heard Central Saanich moved to southern California. Better weather.
Have heard complaints about new rentals too about shoddy construction.
Why does this happen so often when there is a development boom. Back in the 80’s and 90’s it was the leaky condo, this time….https://www.timescolonist.com/news/local/residents-flee-new-11-storey-langford-building-after-warning-about-structural-safety-1.24040511
Where’d central saanich go?
The last reasonable time to buy in Victoria seems to be back in 2013.
I grabbed a few numbers off VREB to show that the gained in 5 years seems to be a bit different than the long term gained. As you can see the spread between Victoria and Sidney is 7.6% over 5 years (or 2.2% spread between W. Saanich and Langford). And, Sooke didn’t make much of a gain in the previous decade previous to 2014, and then accelerated in the last 5 years to catch up, hence the data suggests that Sooke (possibly Esquimalt and the West Shore) may have more legs to grow similarly to Vic West in the near term compare to Oak Bay and Victoria.
In 5 years,
63.81% Sooke
63.37% Vic West
54.44% Victoria
50.66% W. Saanich
50.32% Oak Bay
49.44% Esquimalt
48.40% Langford
46.89% Sidney
However, for the benchmark SFH house over five years things seem quite different, ex.:
OB 50.9%.
Sidney 46.77%
Esquimalt 49.43%
Langford 42.98%
Not sure what this really means?
Not all that different actually. Order remains roughly the same.
At shorter time periods the noise also makes more of a difference. HPI can wander a bit through the year
And what everyone really wants to know- which places will appreciate the most going forward? Will trends continue? Should we all invest in Monaco (world’s priciest real estate, currently), or look for better value in more up-and-coming towns? You can decide. Stock pickers know that trends are powerful until they end, often with an unceremonious hiss and fizzle.
On Teranet top gainers from 2004 to today are Vancouver, Toronto, and Hamilton. After them there is a large pack vying for 4th place including Victoria, Winnipeg, and St Catherines-Niagara. Vancouver and Toronto appear to be pretty consistent with regard to starting year but it affects the placing of others.
https://housepriceindex.ca/#chart_compare=bc_vancouver,bc_victoria,mb_winnipeg,on_hamilton,on_st_catharines,on_toronto
Google is your friend:
https://creastats.crea.ca/en-CA/
https://www.globalpropertyguide.com/North-America/Canada/Price-History
Things look a little different if we look at 5 year HPI.
.
.
.
.
VREB – https://www.vreb.org/media/attachments/view/doc/statsrelease2019_11/pdf/statsrelease2019_11.pdf
Sorry, no particular reason I guess I often just overlook it. I’ve added it along with Highlands and Metchosin to the chart.
Next, please compare appreciation of cities (metropolitan areas) across Canada over the last 15 years (or whatever).
You could pick a representative handful such as Victoria, Vancouver, Calgary, Regina, Winnipeg, Toronto, Montreal, Quebec City, Halifax.
Agreed with Leo that it’s interesting but of limited consideration to most people in the face of other considerations about neighbourhood, house size/quality, etc. The difference in property taxes between an $800k house in Oak Bay and Victoria is $401/yr, or $33/mo. Even though it all adds up, $33/mo isn’t something that I’d factor in at all when choosing which muni to buy a house in.
But I’m thinking of this from the perspective of having a home to live in, not pure investment.
This is an interesting point. If you want to buy a single family house you will likely pay similar taxes in Oak Bay and in Esquimalt, because despite different mill rates the total taxes due are similar.
However if you look at it as wanting to invest a fixed amount, say $800k into a principal residence, then you will pay much less taxes on the $800k house in Oak Bay than Esquimalt. It’s another way to support the old adage to buy the worst house on the best street. If you have a cheap place in Oak Bay you are letting those with the fancy places carry your tax burden. Win win.
I’m not really sure if people think that way though. The real differences between those two houses and neighbourhoods are large so it’s likely not something that people are comparing and will outweigh any tax differences for most.
I’m actually not sure how to best compare the municipalities in terms of real tax burden. Is it best to compare tax bill on the representative house? Or perhaps some calculation along the lines of tax paid per owner? Of course it would have to factor in basic service levels as well which luckily outside of the westshore are relatively similar across munis.
It’s also assuming the rental yield is similar.
I agree a lot of people would look at it like this. Just putting it out there that, putting aside the fact that people own different types and values which vary within a taxing jurisdiction, there is another way to look at it which may or may not be something you want to consider.
A house is likely the single biggest investment you will make and the average Canadian homeowner owns 4.5-5.5 homes in their lifetime. Once you know what you can afford you can determine your purchase price. You can also determine your carrying costs. What doesn’t get as much focus is the overall longer term return on investment considering the purchase price vs. all the expenses/income generated plus appreciation. If you factor mil rate into the ROI equation a lower mil rate means a higher ROI assuming your appreciation rate is similar.
I generally care less about annual tax burden than I do about mil rate for this reason.
I am little curious why Colwood is often left out when you put together charts like this comparing different cities. The population is greater then or equal to many of the other communities on the list. Also with the amount of development occurring I would guess the population should be growing at quite a fast pace, not as fast as Langford, but quick nevertheless.
Do you have data for Metchosin and the Highlands?
Yeah, comparing mill rates between munis isn’t the most useful, because people generally care about the avg tax burden, which has to do with representative house price.
From BC Gov’s page, we can determine the representative tax burden by
mill rate * representative house priceVictoria: 4.9982 * $912,433 = $4,560.52
Oak Bay: 4.4974 * $1,489,028 = $6,696.75
So we can say that for comparable houses, OB’s property taxes are almost 50% worse than Victoria’s.
Thanks, Leo. Things are similiar even using average price, although a small difference.
Thanks Leo. Appreciate the analysis as always.