
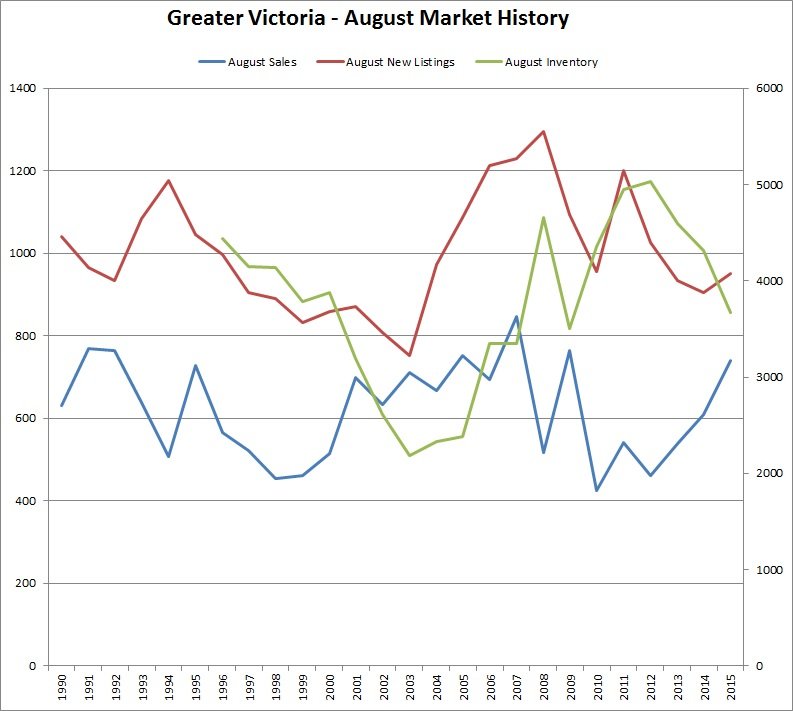
August Sales – History Repeats Itself
After analyzing August 2015 housing sales, I’m getting the distinct impression that history is repeating itself. With a total of 741 sales in August being the highest volume since 2009, and with 3,688 active listings being the lowest count since 2009 – it makes me wonder why sales are following a similar pattern as they did six years ago. You’ll recall that after the stock market was routed in October 2008, the 5-year fixed interest rates (CANSIM V122497) dropped sharply from 6.5% (November 2008) to 4.8% (April 2009).
Of course, this year there have been ongoing market woes (Greece, China, etc.) and a similar downward trend with fixed and variable rate mortgages. The high sales volume and low active listings pattern is not unique to August … as it has been repeating itself over the past four months. Although the number of new listings is up 5% from last year, the last time the number of new listings was significantly lower was 12 years ago! While it’s not surprising that low interest rates are stimulating the volume of sales, I’m at a loss to explain why there are so few properties being listed!
Here’s some different ways of looking at the numbers:

VREB is touting the August sales with a “record” SFH average price in Greater Victoria of $681,449 – but it’s not really a record. After accounting for inflation, average SFH prices were higher during various months in 201 and 2012. Similar for the “record” SFH median price in Greater Victoria of $587,500, which after accounting for inflation was quite a bit higher during various months in 2010 and 2011. As Just Jack recently posted the SFH median price for August varies widely, depending on the neighbourhood. From a low of $460,000 in Victoria West to a high of $857,000 in Rocklands – aggregating the data tends to obscure the detail.
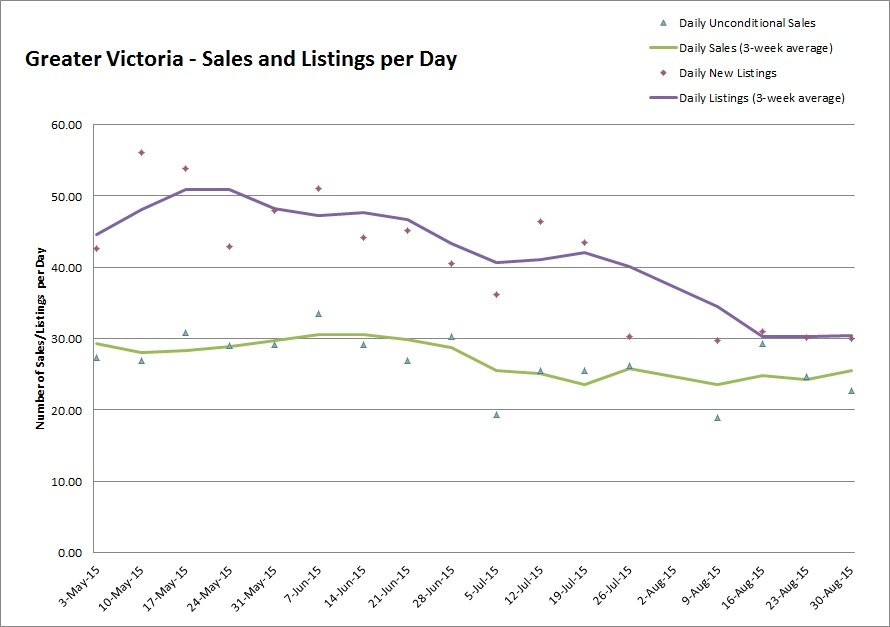
Here are the weekly number for the month of August …
 With 4.98 months of inventory for sale – the housing market firmly remains a seller’s market!
Thanks. 98% from Canada haha. All those foreigners (sorry Torontonians and Vancouverites) driving everyone out of the market!
Not a chance that unit sold for 100k in 1982. Maybe some of the best top units did… it’s the same idea as say the new 2bd/2bth unit a couple blocks east of Leighton that just sold for 963k. There isn’t a chance that unit will double in the next ten years while there’s an excellent chance of the 200k Leighton unit doubling.
For the 200k Leighton all you need to do is make it look something like this 80s condo for 1,350,000 and it will be worth 400k before you know it.
http://www.realtor.ca/Residential/Single-Family/14951619/-203-1675-HORNBY-ST-Vancouver-British-Columbia-V6Z2M3
That one’s not even near a hospital 😉
I thought I should point out that if anyone out there feels they may have missed the bottom on houses, you’re not totally out of luck, as you can now play catch up with a condo while there‘s still some selection left.
You can see how condos ‘slingshot’ from the VREB graph below. In other words, as houses started slowly rising ‘98-‘01, condos continued pulling back, similar to now as houses have been jumping while condos haven’t. Then from ‘01-’07 apartments actually outperformed on a percentage basis as they played catch up.
http://i.cubeupload.com/4d1KZp.png
The slingshot has already started in Vancouver as they are at least a year ahead of us in the cycle. Vancouver houses have been going strong for three years now (one more than us) and just this year Van condos have begun to slingshot ahead to all-time highs.
“For example the condo complex we are talking about. Built in 1982 these condos were originally selling new for $100,000. Today they are selling for a little over $200,000 as 33 year old condos. ”
Very good point Jack. In 1982 you could buy a quality bungalow in the $80,000 range in a very good neighborhood which is now in the $400K range. Which was the better investment ? And this condo on Leighton will double in the next 10 years ? Major BS alert.
Interesting article on our GDP numbers, more danger lurks than first thought. It’s not just oil that’s taking us down. New record debt to income coming out, rising mortgage rates around the corner, and shaky stock markets are not an environment for chasing the current real estate fad.
“Nine out of 20 major industries have been in decline or stagnating for the first six months of 2015. These nine industries account for close to half of Canada’s economic activity (46 per cent of GDP in December 2014).”
http://thetyee.ca/Opinion/2015/09/03/Canada-Worrying-Economic-Trends/?utm_source=twitter&utm_medium=social&utm_content=090315-2&utm_campaign=editorial-0915
I suspected my wording would get misinterpreted,best not post on my coffee break….of course condos have doubled since the 80’s. Anyone who has bought a condo in the last 10 years had made virtually nothing as your chart clearly shows and many have lost bigtime such as the Langford disasters of 30% hits and the older condos that have gone down similar %’s once remediation reports became common place. Commodities have crashed, mines are closing or deals killed, LNG is dead and inflation/wage growth is non existent. Not the signs of a rosy economic picture.
Too bad about that LNG plan, looks like they can stick a fork in it. Christy’s one trick pony just crashed and burned. Now all we have is selling houses to each other and big box store consumerism.
‘Window of opportunity’ for new LNG projects is gone because of supply glut, consultancy says
“There is a clear reluctance by companies to stand down, but the reality is that the window of opportunity closed over six months ago for everyone, not just for Canada,”
“Proposed LNG projects are under pressure as prices are stuck in the US$7-US$8 per million British thermal unit range, compared to the US$11-US$12 needed long-term to make project economics work.”
http://business.financialpost.com/news/energy/window-of-opportunity-for-new-lng-projects-is-gone-because-of-supply-glut-consultancy-says?__lsa=7c71-9ae8
Hate to be a stickler about this, but the graph is showing how average prices for all condos has increased over time.
The problem is that the quality of condos was changing significantly with the newer high rise concrete condos being built downtown and Vic West. If the graph was not showing all condos but how prices for just 1980 built condos were changing that would be different.
For example the condo complex we are talking about. Built in 1982 these condos were originally selling new for $100,000. Today they are selling for a little over $200,000 as 33 year old condos. The reason why the graph shows an average over $300,000 is because the sales are dominated by new or fairly new condos and not just 1980’s built condos.
The average price is a reasonable indicator of price increases but not over extended periods of times. Then it is better to use the repeat sales method popularized by Rober Shiller or similar sales in the complex from different times.
I was thinking more of all the specialist offices that old people frequent. Wouldn’t they be near Jubilee hospital; optometrists, cardiologists, podiatrists…? and lots of hot nurses for dirty old men to ogle 😉
“…but condos haven’t doubled since the 80’s”
That’s true, they’ve gone up almost 6-fold…
http://i.cubeupload.com/z8CyrZ.png
I’ve got 65k to 330k since ‘85… almost as much as houses (6-fold) since ‘85.
I don’t think they will go up 2.5 times like ‘01-’07, but this time a double should be no problem. Of course houses will outperform even with retiring boomers. I`d always go for the house in the core if you want the best upside.
Do your chances of surviving a heart attack improve the closer you live to a hospital?
It really depends on where the ambulance is coming from not how close you are to the hospital.
Correction, closer to $275 increase on a 2 bedroom in 10 years, around $200 for the one bedroom. One year they held off increases due to huge vacancies….and that’s CO, not CO2. 😉
Wishful thinking Mike, but condos haven’t doubled since the 80’s. Saying they will double after all the suckers paid $300K plus for all the $200K older condos (plus the Langford losers), sounds like more misleading bullshit. Rents on apartments in the Victoria area haven’t gone up more than $200 in the last 10 years during the highest inflation period in ages. There’s a 3% thing that keeps slumlords from screwing the average joe.
I even get an extra 200 Sq Ft for my digs and a million dollar view versus breathing all the CO2 living above the noisy main entrance.
Too funny Jack, the equity ladder is getting mighty crowded. But there’s still a shot for Mikey.
https://www.youtube.com/watch?v=jUa2IxbT5_0
Looks like the Leighton condos rent for about $1300, and yes they’re very near hospital and college.
http://www.padmapper.com/search/apartments/British-Columbia/Victoria/211137435/
To own all-in less principle pay down is only $938 (heat & hot water included in $353 fees). That’s what you call a rent vs. own nobrainer! The reason it will double within ten years is simply that rents will easily be $2000 by then (next market peak) and it’s already under priced to begin with.
When it comes to condos it seems like every guy and his dog has at least one if not two condos as investment properties. Condos have become the poor man’s apartment block.
Very easy to buy and with low interest rates you’re are reasonably close to having a positive cash flow. Even if you have to subsidize it a couple hundred a month the potential gains from appreciation seem to be worth it. Eventually you’ll pay enough of the mortgage down to give you a positive cash flow. You may never get a high return on your equity relative to other leveraged investments but it’s a passive investment that you only have to worry about when vacancies occur.
But at some time you have to re-evaluate your purchase. If after 5 years you still don’t have a positive cash flow it may be time to move on. 5 years is a long time to hold an investment without making any money.
Instead of Vancouver you might want to watch the market in the Fraser Valley.
Victoria has more in common with Surrey, Delta, White Rock and Langley than a city 8 times its size like Vancouver. Being on an island, we likely have more in common with Nanaimo than Vancouver.
Another thing is to review is the sales history in the building that you want to buy into. You may find that historically the building under performs, in appreciation, relative to the rest of the market.
Prices originally started at $100,000 in this complex in 1982 and are now at $200,000 and that is in nominal dollars. These older condo buildings also do not have high rents like the new condos. Rents are now along the lines of older rental apartment buildings and are subject to a higher turn over rate and rising maintenance costs.
It’s unlikely that the performance in this complex will improve going forward. I would be skeptical of buying any condo over 5 years old as an investment these days. As its best days as an investment to purchase maybe over. Buying an older condo may mean you may have to hold the property longer before it has a positive cash flow. As an investment you want that holding time as short as possible.
But in fairness. You would have seen an increase in the median condo prices if you had bought in Langford or Colwood at the beginning of this year.
Jan $234,000
Feb $238,000
Mar $265,000
Apr $269,250
May $225,000
Jun $257,500
Jul $248,000
Aug $256,000
Relative to starter houses in Langford and Colwood, condos seem to be the better buy. And are attractive to those who no longer need to live downtown for work. Sell the Gordon Head home for $600,000 and retire to a Langford condo for $250,000.
Opportunities like this do not happen very often in life. You were given a winning lottery ticket. Maybe it’s time to cash it in before it’s too late.
Actually I think that one might be near the hospital too… just imagine what old wheezing boomers will give for that in ten years.
So Hawk, don’t pay 500k, buy a 2bd/2bth steel & concrete for $200k …pay less than you would to rent it.
http://www.realtor.ca/Residential/Single-Family/15861454/207-1745-Leighton-Rd-Victoria-British-Columbia-V8R6R6
After you’ve doubled your money on it and want a house, you could also decide to keep it as a rental (I started out with an apt). Why am I so confident prices will take off soon? I‘ve done this a long time 😉 …vacancy rates near zero, spread between houses, cheaper than renting, Vancouver always leads and is now breaking out quickly…… Apartments always lag houses and then play ‘sling shot’.
The same with the median price for condos in our core. They are down slightly too.
Jan $264,950
Feb $310,000
Mar $279,900
Apr $287,000
May $285,500
Jun $274,700
Jul $291,000
Aug $281,000
The gap between house and condo prices is widening. That makes it more difficult to climb the property ladder.
The same with starter house prices the gap between them and middle income houses is widening too.
It seems our property ladder is more like a weathered one with some broken and missing rungs.
Here’s a video of two North Vancouver would be buyers moving up the property ladder trying to get that dream home.
https://youtu.be/qbep9SgfYDQ
This may also be one of the reasons why listings are so low today. People are reluctant to list their home for sale until they have bought. If there isn’t enough selection to buy – then you don’t list your home. And that has an effect of reducing inventory
Another thing that happens is that people decide to renovate rather than find another house thus temporarily satiating their desire to move on. This is only temporary because they still dislike their neighbors or their hood.
And then you get pent up supply with a lot of home owners wanting to move but stuck in a rut.
This is just part of the real estate cycle. Eventually supply returns to the market since there are always people needing to sell because of divorce, not making their financial obligations, old age, health, relocation etc. The difference now is that these sellers are more motivated to sell.
And so the pendulum swings. Supply always returns to the market because it always has.
https://youtu.be/uPG92YqKx5A
Why would anyone with half a brain pay $500,000 for a crappy wood frame uninsulated noisy wood frame apartment when you can rent one for far cheaper and not have to pay the next $100,000 leaker bill ? It’s called financial sense Mikey.
Correction, the condo prices were down in the Fraser Valley where the average joe lives.
“Condo prices down too.”
Speaking of Van condos (which are actually up alot lately, Hawky boy 😉 ) when you look closer at the above graph I posted, wouldn’t a ‘chartist’ say it’s time to buy?
http://i.cubeupload.com/GC0w8P.png
Sure Mike, if that Vancouver chart you posted is just off a bottom you are smokin some pretty strong stuff. Ever heard of the hockey stick chart? Apparently not.
Wow, as per CBC news,Vancouver commercial office space at an 11 year high vacancy rate. Must be that booming BC economy with thousands of non-existent office workers. Condo prices down too. What happened to all those rosy forecasts ? Kinda like the weather man’s forecast. Only good for a couple of days.
Top? We’re only 2 years out of a bottom. The next top looks to be 2023ish.
http://i.cubeupload.com/T5oeRo.png
Exactly what you see at a market top….total desperation. What the woman needed was a friend to give her a smack to the head.
Prices in the UAE are now leading the world in price declines down 12% YOY. The canary in the coal mine is beginning to tweet.
If you happen to be downsizing like this couple, I’d make sure you don’t sell before you buy… you may end up going door to door with “sell me your home” flyers.
http://www.cbc.ca/news/business/house-hunters-make-personal-pleas-in-hot-markets-1.3209873
“She sold her five-bedroom North Vancouver house in March for $1.3 million. Whyte, her husband Peter and her youngest child planned to downsize and buy a smaller house in the same area.
She had a maximum budget of $1.1 million, which she believed would be enough to find a good home.
But, says Whyte, the following month, house prices suddenly skyrocketed.”
She ended up paying…
“$1 million for a three-bedroom fixer-upper that she figures will need $200,000 in renovations.
“It literally looks like a mobile home dropped on a slab”
Thanks for your support!
Out of the 46,469 visitors to the new House Hunt Victoria (HHV) so far – 91.4% (42,509) are from Canada. Many HHV readers are using VPN routed through the US while viewing the blog, so that number of US visits is higher than it should be. Many of the hits from the UAE and from Canadian Forces members posted in the Mid-East.

It also shows how skittish the Vancouver market can be. The wide price swings at the end of the market at nearly a hundred grand in magnitude.
This is a graph of an earthquake not a real estate market.
Here’s the latest Vancouver numbers if interested.
http://i.cubeupload.com/pyMhc0.png
Probably safe to say Van will hit 2M before we hit 1M.
When they are asking outrageous amounts over assessment prices versus the core, no wonder sales suck up on the hill.
It’s pretty bleak in the core if you’re a first time buyer. Poor selection and high prices.
But if you’re selling….
https://youtu.be/lgfHjjgi0GQ
48 more listings in August totally neutralized plus some by the 132 increase in sales.
Also keep in mind we are comparing this year to a half decent August last year. We had a 425 sale August in 2010 and a 462 sale August in 2012.
Listings are down from last year on Bear Mountain, for the last 90 days, from 56 to 44. Seems like the Albertans working out of province aren’t willing to leave the city just yet.
Scratch the above made a boo boo on the dates. Have to redo the math.
I totally agree… Do you have access to such information?
The Albertans tended to like new housing and for some unknown reason liked Bear Mountain.
Today there are 68 properties for sale on the mountain.
33 were listed for sale in the last 90 days up from 30 the year before. Not much of a difference but still up from last year.
Off topic
DavidL great job on blog. It is much better than the old styling.
Just wondering if u could post visitors by country again. It would be pretty interesting to see!
It could also be due to our arbitrary unit of measure – one month.
Perhaps looking at equal sized blocks of 250 or 500 sales would be a better measure of acceleration in the market.
” If you can’t borrow, you can’t buy.” Exactly. So unless you have a pile of cash you won’t benefit from a crash of epic proportions anyway… Posted rates will only be for those that have money. Rates for those that don’t would be even higher. So if you could borrow you will probably pay more anyway. I’m about to renew my mortgage. Fingers crossed it’s less than the first. 9 years of sub 3% does affect the bottom line…. I probably can’t help myself and will go for fixed if it’s close to 2.5%.
No market moves in a steady line…. This is why you have moving averages, BoilerBands, ADX graphing etc… It’s why most don’t see flat when it’s flat…. Not that it’s going to be flat moving forward….
Actually, I stated:
… and you are correct that the number of new listings was lower last August. Thanks for keeping me honest! I’ve corrected the original post…
Agreed on the sketchy economy but rates are going to stay low for a long time to come.
“the number of new listings at an all time low”
Actually, August 2015 listings at 905 were one higher than August 2014. Perhaps the market just turned.
The 377 SFH’s in August and the closest level of 399 in 2007 is interesting timing with the stock markets beginning to fall apart, same as in 2007 when things began to deteriorate but buyers kept dumping cash into real estate at the top. History will repeat itself with a bigger bang this time as rates will be going up this time around. The credit market will be the catalyst once again as high yield bonds are getting beat up bigtime, always a precursor to tightening lending markets. If you can’t borrow, you can’t buy.
Oil down 7% today too ? I wonder how many of those 35,000 Alberta oil job layoffs live in Victoria that don’t get counted as BC job losses ? 100 ? 500? or even 1000? More jobs lost every day it seems.
http://business.financialpost.com/news/energy/fresh-wave-of-layoffs-hits-oilpatch-with-pennwest-conocophillips-cutting-900-jobs
I was using benchmarks, but I do like your way… 655000/542500 = up 21% since January 😉
That wouldn’t be the right way of calculating acceleration in prices. Because in 2014 the median was declining making any year over year comparison widen considerably.
Instead you should measure the acceleration month by month.
These are the medians for house prices in the core
Jan $542,500
Feb $597,500 10%
Mar $625,000 4.6%
Apr $631,200 1%
May $620,250 -1.7%
Jun $629,900 1.5%
Jul $610,000 -3%
Aug $655,000 7.4%
You can see that this wouldn’t be anything like the steady acceleration from a Ferrari.
I guess it’s no surprise but that’s some impressive acceleration in the y-o-y benchmarks…
Aug 8.4%
July 6.3%
June 4.6%
May 4.0%
April 3.5%