
Housing prices follow mortgage rates?
It is commonly accepted that housing prices and interest rates are inversely proportional to each other. When interest rates rise, prices drop – and when interest rates drop, prices rise. I’ve often wondered how closely prices and interest rates may track each other. Until recently, I didn’t have a good enough data set to try to come up with an answer. Thanks (again) to Leo S’s efforts collating historical housing and financial data, I was able to produce a chart to compare the three-month average of the median Single Family Home (SFH) selling price with the three-month average of the available 5-Year lending rate (as published by StatsCan CANSIM v122497). A three-month average was chosen to “smooth out” any month-to-month volatility while maintaining the general trend.
Examining just Single Family Home (SFH) prices excludes those who are (or are considering) living in a townhouse or condominium apartment. However, with the larger principal mortgage amount incurred with buying a SFH, the effects of compounding interest imply that a SFH with a larger price tag would be affected more by interest rates than compared with less expensive real estate. Here’s what the results look like:
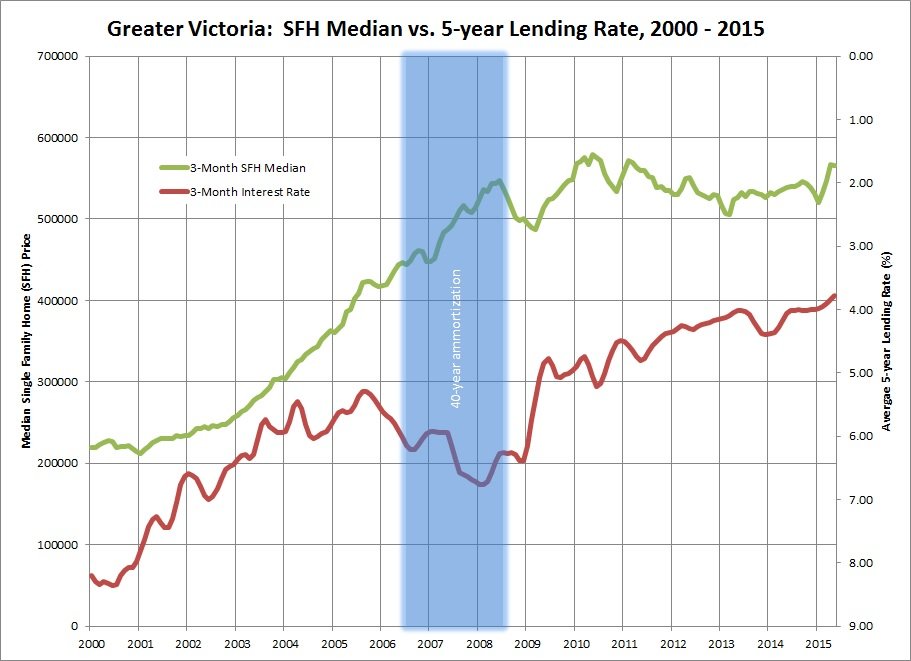
Note that I have charted SFH prices and the lending rate on reversed axes because prices and interest rates are inversely proportional. That is, as interest rates drop – prices go up. Or do they? Sometimes other factors may have been at work …
2000 – 2006: Heating Up
As rates steadily decreased from 8.50% to about 5.25%, SFH prices rapidly shot up. Note the lag time between interest rate drops starting in post 9/11 and the minimal SFH prices changes until 1½ years later. Only then did the market really begin to heat up and get some momentum. Even when interest rates were relatively flat between mid-2003 and early 2005, prices continued to quickly climb.
2006 – 2008: The Sky’s the Limit
Between 2006 and 2008, interest rates climbed by more than 1.50%. At the same time CHMC introduced a 40-year amortization, effectively lowering the mortgage payments. Is it any wonder that prices kept on rapidly increasing? Warning signs about the Global Financial Crisis started in 2007, but it wasn’t until mid-2008 with the sub-prime mortgage crisis in the US (and the resulting lack of available credit) that Victoria’s housing prices began to rapidly cool.
2009 – 2011: Crash and Rebound
In November 2008, emergency interest rates were introduced to “stimulate” the credit market. Not too surprisingly, the 1.25% drop in interest rates re-inflated the housing market with prices surging to all-time highs in the spring of 2010. The phrase: “I have to buy before I’m locked out forever” was common around the water cooler (or Brita jug).
2011 – 2014: Stagnation
Since 2011, a steady but slow decrease of interest rates didn’t seem to have any positive effect on SFH prices. During these fours years, SFH prices slid by about 5% to 10% (depending on the neighbourhood). When factoring in inflation, the actual drop in prices was even more.
2015: Seller’s Market
With a 0.25% drop in the overnight rate by the Bank of Canada and a 0.15% drop in the average mortgage rate – suddenly we have a seller’s market (in the core) with very low inventory and high sales volumes. The median price has climbed, but could it be that more higher-end homes are selling? Are the low interest rates the only reason for high sales volumes, or could the concern about an impending rise in fixed interest rates be stimulating sales? It’s like 2010 all over again!
[…] inversely proportional pattern has persisted for the past 15 years (covered in more detail in my Housing Prices Follow Mortgage Rates? blog […]
[…] as when interest rates drop, prices in Victoria may – but do not always go up (outlined in my Housing prices follow mortgage rates? […]
This housing researcher explains it well…
“It’s a common belief in real estate that house prices are correlated to interest rates. The idea, beloved by homebuyers, is that if mortgage rates rise, prices of homes for sale must fall because otherwise those homes will become less affordable.
The problem with this belief is that, well, it’s not true. In fact, there’s no strong relationship between house prices and interest rates, according to Mark Palim, vice president for applied economic and housing research for Fannie Mae.
“Rates tend to rise because, in a relative sense, the economy is doing well, incomes are going up, people can afford more and they’re willing to take out a larger mortgage. Intuitively, you’d think that if interest rates go up, of course, house prices go down. But they don’t,” Palim says.
“The bottom line is that other factors (like a stronger economy) have a bigger impact on house prices than changes in mortgage rates,” blogger Bill McBride writes in a post on his financial blog, CalculatedRisk.com.
@Leo
The finances of the seller won’t affect the selling price. It’s the new buyer who dictates what is affordable and they would be driving down the price.
By my estimate, a 1.5% increase in rates would cause a 10% drop in prices. Consider that during the past five years, prices in Victoria have dropped by 5% to 10% while interest rates have also dropped by 1%. An increase in rates would only accelerate price drops.
That would be the simple mathematical relationship. I assume not everyone is 100% maxed out, hence the raise in interest rates not reducing prices by the mathematical maximum.
Agreed, caveat. The author, Peter Ferrara, is a real piece of work. Total hack. The article is full of half-truths and omissions that are clearly intended to mislead readers who might not be familiar with how the Bureau of Labor Statistics collects and reports unemployment data.
The Forbes article is a joke. “Record number of people not working!”. Given that the population is growing we should expect new record numbers nearly constantly even if the employment/population ratio stayed constant.
It is true that the employment/population ratio has fallen in the US. Some of that is due to a weakish economy but more is due to demographic change – more retired people.
Basically the article is blaming Obama because (1) the population is growing, (2) the population is getting older
The math on this statement just doesn’t add up. Take a $500,000 house that could be purchased with a fixed mortgage at 2.85% versus the same house with a fixed mortgage of 4.10% (a plausible 1.5% more). According to Dejardin’s, the resale value of the house would drop by 3.6% ($18,000) to $482,000. [That is: $500,000 – (1.5%/0.25% * $500,000).]
When looking at how the interest rate affects mortgage payments – the math work out a little differently … Even with a 20% down-payment, the $400,000 mortgage at 2.85% with a 25-year amortization would be: $1,862.33/month. At 4.10% with the same 25-year amortization, the monthly payment would be $2,125.82 – working out to an extra $263.49/month. If the interest rate were to increase 1.5%, in order to keep the mortgage payment the same ($1,862.33/month) – the mortgage amount would need to drop to $350,420. Assuming that the monthly payment to service a mortgage is the limiting factor for property prices, this ~$50,000 drop caused by a 1.5% increase in interest rates suggests that each 25-basis-point increase actually causes a 1.67% decline in the resale value.
Okay. Thanks, Marko!
Yeah, I was hoping that it would stimulate discussion! 🙂
Nothing really, just has showing schedule or other intructions for realtors to read.
Out of curiosity I looked it up for Canada too: http://www.statcan.gc.ca/tables-tableaux/sum-som/l01/cst01/econ10-eng.htm
As of 2014 it was 61.4%.
This is what the author of that Forbes article is referring to: http://data.bls.gov/timeseries/LNS12300000
You can pull up employment data all the way back to 1948 and see that there are usually 55-65% of Americans in the workforce. Right now it’s around 60%.
The population-employment ratio is a measure of all Americans over the age of 16 who may not be working for any given reason. For instance they may be in high school, college, stay at home parents, retired etc.
It’s not saying that there are 100,000,000 people who recently lost their jobs and haven’t found new ones yet.
DavidL,
No, there are about 10 million classed as unemployed, but 102 million people classed as not working. That’s mind boggling but true.
http://www.forbes.com/sites/peterferrara/2014/01/24/after-five-years-of-obamanomics-a-record-100-million-americans-not-working/
Did you mean 10 million? About half of the working US population would be 100 million…
backwards,
There are also 100 million Americans who never got rehired after the last market crash and are never mentioned. They lost their jobs, homes, went bankrupt and are excluded from official job reports.
As the pros have said, Canada is an accident waiting to happen, free money doesn’t go on forever. Corporate profits in the US are falling and posters here think wage growth in Canada’s declining economy is going to go up to boom time levels ? Not sure which magical economics book some here are reading or what they are smoking.
http://www.marketwatch.com/story/us-corporate-profits-sink-59-biggest-drop-since-2008-2015-05-29
You forgot about Vancouver being the North American Chinese money laundering capital there Michael. Which real estate company do you work for again ?
If you see wage growth expectations similar to 80’s and 90’s based on your predictions of Vancouver style housing price increases you are dreaming. No way any corporations or government nor small business will be giving out 3-5% wage increases as in past booms. Most are getting 1% or being offered 1% range max. We are nearing the end of a 7-8 year cycle, not starting one.
I have to say DavidL, you picked a good topic for a lively debate. 30 comments in less 24 hrs… even if almost half are mine…lol!
I’m seeing more listings with “Buyers agent to see M2M Notes” in my VREB Matrix than in the past. What would this signify?
Let’s look at that RBC Housing Trends and Affordability report in more detail …
According to RBC, the Housing Affordability Measures show “the proportion of median pre-tax household income that would be required to service the cost of mortgage payments (principal and interest), property taxes, and utilities on a detached bungalow, a standard two-storey home and a standard condo (excluding maintenance fees) at the going market prices“. Additionally, “the measures are based on a 25% down payment, a 25-year mortgage loan at a five-year fixed rate“.
Michael – I award you the champion of cherry-picking.
For starters, you may want to look at the divergence between Toronto and Van-Vic in the early nineties. That was a doozy.
RBC has us back to about 42% of pre-tax income for June 2015.
http://i.cubeupload.com/rdNPLt.png
Rising rates equate to rising wages. As much as I see quickly climbing wages (especially in economic leading BC), it’s the rise of Asia-Pacific as the wealthiest region and their recent recognition of smaller cities like Victoria as to why we could close the gap on Vancouver. Politically stable, beautiful cities, with land constraints and good climates will be inundated to the point that affordability for average locals likely won’t make sense. Even if we only receive the displaced Van’ites (and TO‘ians), we could soon be swamped with snobby centre-of-universe types 😉
They track each other about the same as all Candian cities roughly track each other if you look at Teranet. There is no special relationship between Vancouver and Victoria.
I already mentioned (above) why Vic didn’t track Van as well after 2010…
“one exception was when USA prices out-competed Vic for retirees et al from ‘11-‘13. Otherwise, Victoria has essentially followed Vancouver…”
If you plot both together you can see Vic typically tracks Van very well. My guess is Vic now accelerates faster than Van to close the gaping gap 😉
http://i.cubeupload.com/T5oeRo.png
… and why are things different than the 1970’s?
CBC News: 2-income families nearly doubled from 1976 to 2014
Families with both parents working are a substantial majority in Canada, with 69 per cent of couples with a child under 16 years of age having two incomes, according to Statistics Canada. That contrasts sharply with 36 per cent of couples with a child under 16 having two working parents in 1976 and represents a 92 per cent increase.
Hmmm, I wonder what happened to Vancouver house prices after 1980? For some reason the chart stops at that exact year….
Guess I’ll have to ask my grand pappy.
http://thedependent.ca/featured/land-destiny-history-vancouver/
“Incredibly, by 1912, – at a time when wages were roughly 50 cents an hour, and a tailored suit cost less than $40 – a lot in the very same area was worth $725,000… By 1912, the market was an orgy of borrowing, spending, and inflation”
Again, my only point is house prices and interest rates often rise (soar) together, especially after a long period of falling rates (like we just experienced). The “why” isn’t too hard to figure out.
There are always wars and droughts, and today will seem rather unsophisticated 70 years from now.
If you think it’s different this time than 1942, then how about 1900.
http://www.ritholtz.com/blog/wp-content/uploads/2012/01/Long-Term.png
Thanks! 🙂
All this talk about prices and interest rates, and no talk about wages. Take the median income of $55,200 in 2000, and 5 year fixed posted interest rate of 8.75. Consider that the average SFD price was $251,000. Mortgage payment is going to take up about 43% of pre-tax income, assuming 5% down.
Fast forward 6 years, and the average house price has hit $521,000. Now the posted 5 year fixed rate is 6.75%. Mortgage rules are getting stupid. You can go 0 down and amortize over 30 years. That’ll take up 57% of your pretax income. Dumb and unsustainable. 8 years later, and that number has fallen back to about 48% because of flat house prices, falling interest rates, tighter mortgage rules and modest wage growth.
When rates rise, I would guess that without wage growth, house prices will stay flat and fall over the longer run. With wage growth, flat to modest price growth. If you expect prices to more than double like they did in 85-95 and again in 00-10, you’d better be banking on explosive wage growth. We are in an era where interest rates can only go up, following 25 years of rates going down. Or you’d better hope for an influx of foreign capital.
The chart you’ve referenced does not include the past five years (2010 onwards). During this time, the average detached house value has increased by 16% in Vancouver while falling 5% to 10% (depending on neighbourhood) in Victoria. The chart (courtesy of REBGV) shows the trends:

I don’t buy your argument that Vancouver and Victoria prices track each other. Perhaps I’ll find a good data source and be able to compare them directly in a future post.
Absolutely it is different this time! In 1942, we were embroiled in WW2 after a 10-year depression (following the 1929 stock market crash) and the Dust Bowl years. Until the war, very few women were working (i.e. one income families), the birth rate was higher than now, and financial institutions and governments were not nearly as sophisticated.
…and by the way, that’s REAL prices quintupling… nominal would have been much higher.
Here’s another example of mortgage rates tripling (from 7% to 21%) while prices quintupled.
http://i.cubeupload.com/8L7RQ2.png
Just ask your grand pappy about it 😉
Are you saying it’s different this time?
We should be safe…from Desjardin’s Report in 2014
http://www.desjardins.com/ressources/pdf/pv140526-e.pdf?resVer=1401111569000
Conclusion
Due to its impact on the economy and its heft in household
balance sheets, the real estate market deserves special
attention. Concerns about an overheated market in recent
years, especially after the shakedown in the U.S. market, are
justified. The spiralling increase in household debt, largely
attributable to the real estate market, makes households
vulnerable to rising interest rates. This study reminds
us that an increase in interest rates would clearly have a
negative impact on the real estate market.
This study showed us that each 25‑basis-point increase in
Canada’s key rate triggers a 0.6% decline in property prices
after four years, vs. the original equilibrium level, all things
being equal. This does not necessarily mean that home
prices will be weaker in four years compared to today;
instead, they will be weaker than they would have been
without an increase in key interest rates.
Why consider 1942 when the world is so radically different than now?! Heck, I remember in the late 1970’s when depositing my paper route earnings at the credit union, and the clerk handwriting the deposit in my bank book. We are in a different millennium now…
I guess I should show how rates used to be this low (1942).
http://i.cubeupload.com/b059nB.png
The last time rates were this low home prices took off and climbed 10-fold by the time rates hit the mid-teens.
http://i.cubeupload.com/8UywlX.png
Book it, by Shiller 😉
Hawk – re the article you linked: “In the past few years, the job market has vastly improved and home prices have rebounded…” The job market stats have again been manipulated. A lot of the new jobs have been part-time retail/Mcdonalds jobs, no benefits. And house prices have rebounded in certain markets, but a lot of that has to do with private equity firms who bought up thousands of homes. There are still many, many people living in homes that haven’t paid their mortgage payments for years, and there are a ton of HELOCS still outstanding. Again, this is all just kept very secret.
Most Americans are tapped out, while the .01% are raking it in. Once the Trans-Pacific Partnership Treaty passes the U.S. Senate and Congress, Americans and Canadians will be kissing more jobs good-bye. But, of course, the politicians say “it’s all for the people.” Yeah, right. It’s for the corporations. People had better wake up.
Michael – “… feds follow and slowly raise rates to manage inflation (housing from overheating).“ Yeah, like that`s been happening! LOL. I do believe our housing has been overheating, yet I don`t see these `slowly rising rates` you speak of. Very creative writing, Michael. You really should be writing for real estate boards.
Stephen Poloz, our genius Governor of the Bank of Canada, apparently doesn`t see a bubble. I don`t know where he`s been living, but apparently he`s blind. Or he sees the bubble, but can`t say he does as that would imply intent, and intent makes you culpable. I think it must be the latter.
Michael – “Bottom line… housing goes up, people feel wealthy, spend more money, economy goes up, feds follow and slowly raise rates to manage inflation (housing from overheating)… housing eventually goes down, economy suffers, feds slowly clue-in and lower rates to try and soften economy’s (housing’s) fall.”
I think you have this backwards. I believe the Feds come in first, same as when Greenspan held interest rates too low for too long. That’s how they manufacture and engineer bubbles. Then, AND ONLY THEN, do people jump on board the engineer’s train. A few years later, as more and more people pile on board, and the Feds tinker and manipulate amortization rates and banks provide no doc/no more down/cash back loans to anyone who breathes, and the last suckers are unable to climb on board, the whole thing crashes.
The Fed then artificially suppresses interest rates again, hoping to suck people back in and hoping to stem the fall in house prices (gee, I wonder if they`re on the bankers`side). Speculators and realtors are cheering in the wings as the “big suck” gains momentum, and the whole fiasco begins again.
The last forty years has been one giant debt-filled bubble. Mortgage rates are the lowest they have ever been, yet house prices are the highest. If rates rise, house prices will come down. Book it.
You are speaking from historical perspectives which previously never included HELOC’s and over borrowing to new unheard of levels beyond the US levels before they crashed. I assume you own 4 or 5 houses if this is such a slam dunk ?
ICYMI, the 70 million Americans are just like us, poor savers and not prepared for the next major financial disaster which eventually happens. This time no lifeboats to save the ship.
http://www.marketwatch.com/story/70-million-americans-teetering-on-edge-of-financial-ruin-2015-06-23?siteid=nwtpm
I should have said “why rates and house prices can OFTEN rise together”, not only sometimes.
A person needs to look at a longer history of housing and rates to understand the basic relationships… I’m not sure why people still have such difficulty with grasping how house prices, rates, inflation, economy can affect each other… iow, why rates and house prices can sometimes rise together.
http://i.cubeupload.com/1SuaLa.png
One need only look to the economic center of Western Canada. Victoria mirrors Vancouver; one exception was when USA prices out-competed Vic for retirees et al from ‘11-‘13. Otherwise, Victoria has essentially followed Vancouver, just not to the same extremes.
Bottom line… housing goes up, people feel wealthy, spend more money, economy goes up, feds follow and slowly raise rates to manage inflation (housing from overheating)… housing eventually goes down, economy suffers, feds slowly clue-in and lower rates to try and soften economy’s (housing’s) fall. There’s another part to it of course… economy starts to rise, investors dump bonds for other assets sensing inflation, bond yields rise.
Good work DavidL. Keeping the dream alive.