
May Sales up, Listings Down
May 2015 saw 905 properties being sold in Greater Victoria – a 26.8% increase in sales over May 2014, and the highest number of monthly sales in May since 2007, when 963 properties were sold. There were also just 4,043 properties listed for sale – a 13.5% reduction from the 4,672 active listings at the end of May 2014.
Many thanks to Leo for providing me with copies of his excellent spreadsheets. Adding the latest sales data yields the following charts:

The trend during May over the past few years has been decreasing inventory and increasing sales. Is it just low interest rates driving pent up sales demand – or is it something else?
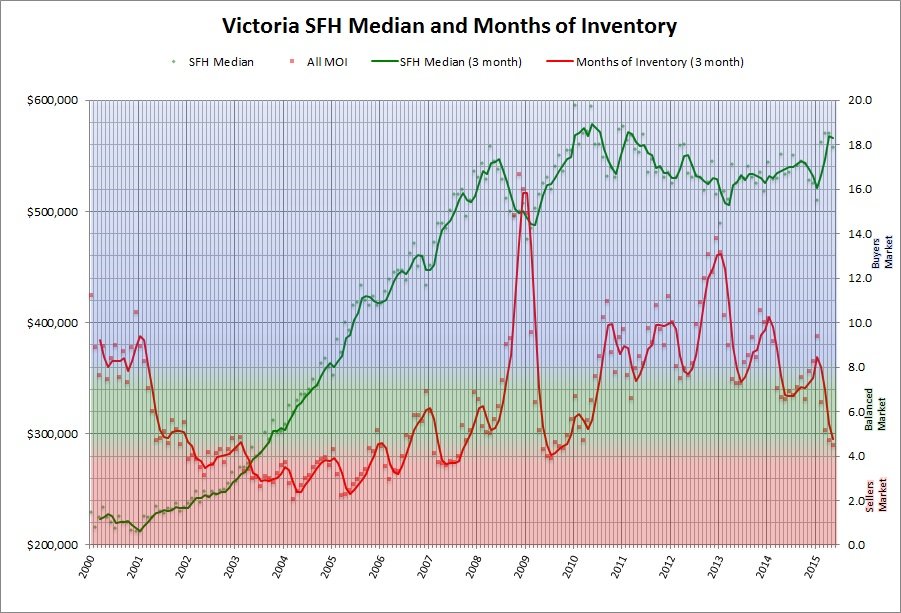
With 4½ months of inventory, we are sliding from a balanced market to very close to a sellers market (when there is less than 4 months of inventory). Not too surprisingly, the lower inventory has caused the smoothed 3-month SFH median price to quickly climb this spring, further benefiting the seller over the buyer.
There was some discussion that this percentage may have increased lately. However the VREB is no longer asking this question so we’ll never know for sure.
Apparently foreign buyers make up just 1.64% of the Victoria market:
http://www.greaterfool.ca/wp-content/uploads/2015/05/VIC-BUYERS-CHART.png
Victoria is not on the radar for many jet setters. Most people have no clue about Victoria or where it is, as illustrated on the Jeopardy game show a few days ago: https://youtu.be/uAdDUD6L1nc
From ’87 – ’93 Victoria houses went up 150%, but as David mentioned you have to factor out about 25% inflation for that period from the calculator. Still more than a double in real terms. The surprising part to me was they doubled while Toronto nearly fell in half in real terms. Then again, Victoria experienced a fairly severe decline in real terms ’10-’13, while Toronto did very well. Canada certainly isn’t a unified housing market.
Inflation from 1990 to 2000 was 22%, according to the BOC inflation calculator at http://www.bankofcanada.ca/rates/related/inflation-calculator/. Essentially, housing prices in Victoria were flat for 10 years in the 1990’s.
Vancouver has always had a minimum 20% price edge over Victoria. People moving here from Van with more bucks is nothing new. Once more homeowners on the fence realize the party is just about over,the listings will start to come out of the woodwork. Every cycle has a catalyst, just a matter of when.
Rental Markets will remain strong
But not for the reasons you think. Landlords in Victoria 25 Years ago were mainly INDIVIDUALS. If you look at the Victoria now, they are now corporations or REITS. They have better access to capital and @ cheaper rates. They are much more willing to let a property stay empty to get the rent they “want” as opposed to giving it away cheaper. It would be interesting to find out how many “empty” apartments there are in Victoria owned by these guys, but my guess it would number in the high hundreds.
Prices will keep on rising if interest % remain low and floodgates are open to rich immigrants from the 4 corners of this earth.
The wealth being created worldwide is heavily distorted to the rich 1% of 1%. That’s a lot of people if u look at India, China, SE Asia, Africa, etc… Making a few million dollars for them is a few years of work, whereas that might be a lifetime for most people in Canada.
The issue is their top destinations are Canada/USA/Australia/UK. As long as population growth (all) > is greater than demographic changes (deaths), we will see influxes of money into real estate. First it will be 1st Tier Cities like Vanc/T.O./Montreal, but once they realize what a s***hole those cities are, they’ll look at 2nd Tier Cities like Victoria, Calgary, etc…
First time HH will be squeezed out, and will decide if lifestyle/employment variables dictate a move to different locale. That’s why so many people are moving from Vancouver to here, we personally know of 5 families in the last 2 years. The trend is not going away, and unless we have progressive policies to find ways to increase RE supply in the core (e.g. via density or opening up the ALR), this problem will not go away. There is tons of land in the core still, so prudent decisions now can offset the systemic changes occurring worldwide.
Shouldn’t be a problem, we will be at 200% of income if house prices are about to go on a 25% increase like in the 90’s like Michael is saying. With a 1987 stock market crash event that won’t effect anything other than a “hiccup”, then why not just go all in with all your chips now for the guaranteed payoff ? Why are we not camping out overnight with line ups like Toronto and Vancouver ?
I just can’t figure out how this prediction involves first time buyers affording the ride if prices head up even 5-10% ? You need the first time buyer or the markets don’t move up. Irrational exuberance indeed, less 40 year mortgages.
For sure. A good example is how Victoria barely hiccupped in 1990 as Toronto began crashing.
In fact as Toronto got obliterated from 90-94, Victoria prices did the opposite and surged higher.
http://4.bp.blogspot.com/-d5OSAlXFDhY/Unbs4RZjAoI/AAAAAAAAC8M/MUDk39h7ey0/s1600/compisite+real+home+prices.png
I still think there are alot of parallels today with say late 1986. On that note, at least be wary of a black Monday (Oct’87) type event sometime in the next year. A blow off top run up first would be a good hint. Also note that interest rates did steadily rise a bit between ‘87-90.
It appears that the current buying frenzy is being funded by ever-increasing debt…
Household debt rises 4.6% to $1.82T in April
http://www.cbc.ca/news/business/household-debt-rises-4-6-to-1-82t-in-april-1.3098583
Certainly for someone wanting to “cash out” and move to Victoria to retire.
Except that it makes it seem very affordable here….So in the mean time it might put more upward pressure on prices here.
When this does finally end… it will be a nasty correction! Toronto 1990 comes to mind.
“…416 area code now tops $1.1-million, up more than 18 per cent from a year earlier”
“…detached homes in the Vancouver area climbed 16.3 per cent in May to more than $1.4-million.”
http://www.theglobeandmail.com/report-on-business/canadians-now-owe-a-record-182-trillion/article24755595/
Rental market is definitely tight right now for anything half decent. Two of my three places are rented to medical residents and the third tenant I’ve had in place for 2.5 yrs with zero problems.
Had 11 rental applications at the ERA and I think I only showed it to 12 or 13 people.
I think listings are down because the rental market is good. Renting your first place and buying up is a decent option if you bought before the last step up. I know people who did this because the market sucked for selling two years ago and now that they have been landlords for a while it just makes sense. Why sell now?
I guess the last step up was really ’02-’08.
I like your trendline idea but prices usually end up behaving like a grand staircase, flat steps (94-02) then steep rises (03-10).
I have to go with a $650-670,000 median for SFH by end of 2016. We have now fallen to the same M.O.I. as the end of 2001 and have entered sellers market. As we exitted that 8 year trading range (’02), prices increased 25% in the following two years. 2015 should somewhat mirror 2002 with lower gains as price pressure always lags, but 2016 should increase substantially like 2003.
During that previous 25% rise there were 5 quarter point bank rates increases. I’m expecting fewer by end of 2016 as are most people.
Agreed on the benchmark price DavidL, especially the line where it says something to the effect of “created by a group of real estate agencies”, not an independent group. I don’t think they can fairly calculate in inflation factors etc either.
As well there are many people who live in Victoria and fly to the oil patch every week. Just have to stand in a line up at YYJ on Sundays and Mondays when the shift changes seem to be. I imagine the line ups are less as I heard first hand that northern BC is a train wreck with hardly any gas drilling going on. The EI hasn’t run out yet either so hard times haven’t completely kicked in and will be a delayed effect.
…will continue. As long as interest rates keep on going down, it would not surprise me with another 0.25% to 0.50% move in rates:
SFH 2015: $575,000 by year end with historic low rates 5 months of inventory
SFH 2016: $600,000 by year end with historic low rates 5 months of inventory
Just looking @ trendlines, but it won’t get easier for HHVs looking to buy their first home anytime soon. All these over asking prices are surely padding the pockets of PTT of the provincial government.
FYI: there are over 80+ permit applications @ OB Hall right now for new developments or large renos. Normally there are only 40 @ any given time.
Irrational Exuberance…
Although physically closer to the oil patch, I’m told by relatives living in Edmonton that the economy there is more diversified than Calgary’s. The longer the “oil slump” lasts, the more prices will come down in both cities. Although I don’t have accurate numbers, I also gather that many oil patch workers were from other provinces, including BC, such that if they were laid off – it may also affect other parts of Canada.
Surprising cause I detest those 80s cabinets in the kitchen and baths. For me that would be a gut job.
I still think benchmarks are slightly more accurate than say medians. You can read up on VREB as to why. Maybe a 4-month rolling median gives a better market view in some cases, I don’t know.
However either way, whether Calgary is up 1% benchmark or down 0.26% median (not a big difference… in other words, flat) it’s surprising as I would have guessed it would be weaker after a year of oil falling in half.
For Edmonton, the all residential median is up 2.24% Y/Y (since you seem to prefer medians). Maybe it’s just me, but I find it puzzling how strong ALberta cities are remaining after their main resource got punished so hard.
I gave you a like – for old times sake.
2641 Margate $100,000 over asking….wow.
Those results show you how inaccurate the “benchmark” price is! Comparing prices for May 2015 and May 2014 in Calgary shows a 0.26% drop for the median and 1.53% drop for the average. See: http://www.creb.com/Seller_Resources/Housing_Statistics/
I like to analyze real numbers and have significant issues with “benchmark” prices. A benchmark price is calculated from the Home Price Index (HPI), which according to CREA: “the MLS® HPI is based on the value homebuyers assign to various housing attributes, which tend to evolve gradually over time.“. I interpret this to mean the the HPI in no way represents actual market trends (based on real sales data), and instead represents their perceived interest of a potential homebuyer.
CREA also states: “this means that price changes calculated using the MLS® HPI are less volatile than those derived using common measures like average and median, which can swing dramatically in response to changes with high-end or low-end sales volumes over time.“. By their own admission, sudden changes sales volume and/or prices in the property market will not be reflected in the HPI.
And finally, “it is often difficult to determine if average or median price fluctuations really reflect changes in buyers’ willingness to pay for certain housing attributes, or just changes in the volume of very expensive or inexpensive home sales from one time period to the next. The MLS® HPI removes that uncertainty.“. How very kind of CREA to remove uncertainty that potential buyers may have!
I thought I’d check Edmonton and I’m baffled there too as it’s looking strong as ever. I honestly thought there would be weakness by now.
http://edmontonrealestateblog.com/files/2015/05/EdmontonHomePrices4.jpg
Here’s a puzzler…
………………..May’14.……May’15
New Listings….4311.………3161
Oil Price………$105.……….$55
The city is Calgary and the benchmark price is up 1% since last May.
You would think the pink slips this winter would have resulted in more May lists.
The market top must be in if the big bucks are locking in at these low rates. It is the spring rush after all but with limited selection which makes you wonder how many buyers on mass could be left. You would also think most realtors would be urging caution in such a tight market and wait til summer/fall to see if more listing show up.
Sheesh, have we forgotten info already? It was a joke!!!!
The graphs don’t have to be adjusted for population as the real estate market only comprises what is for sale and not the total number of homes in a city.
What you bought a house a decade ago for has no bearing on today’s prices. A home that isn’t on the market or those not bidding on properties have no effect on prices.
Just like at a Kilshaw’s auction people that are not bidding aren’t driving the price up.
No.
It would take quite the historic month to pull off 1000 sales but the way the sales are coming in yesterday and today I would not be shocked…the high-end stuff has started to move too.
Are these graphs population adjusted?
The average house in Vancouver is up $198,637 since last May !
As friggin nutso as that is, you have to wonder if there’s a 15 % or so yearly move in Victoria’s future. For the record I hope not, as in my mind that would mean we’re becoming Hongtoria, and Hongcouver is way too congested for my liking.
The Colonist starts with the words “solidly locked in the seller’s favour”
http://www.timescolonist.com/business/real-estate-a-seller-s-market-with-best-may-in-eight-years-in-capital-region-1.1954246
The media could be contributing to fewer listings.
It’s a combination of how much inventory there is, how fast that inventory is being replenished and how long it takes to sell the inventory Overlay that with how quickly prices are increasing.
This current market is similar to what happened when the market was over stimulated with cheap rates and lose credit policies except our prices are not rising as fast.
Why this is happening in cities like Toronto, Victoria and Victoria and others at the same time is not known. It’s a bit of information that we don’t have about national lending policies.
CMHC says its total mortgage liability isn’t increasing. Does that mean Genworth is now developing a larger market share? Have the Conservatives surreptitiously opened the lending spigot just before an election to make us feel wealthy?
It wouldn’t be the first time that CMHC has been used as a tool by a political party.
I wonder if the low interest rates are pulling forward sales from the summer, just like a few years ago (2013?). If the sales numbers drop off in July below the norm, then we’ll know for sure…
> But Greater Victoria single family home median prices are down 2.2%
That is an 8 year period. Real estate moves slowly but not that slowly. You have to look at the recent trend, and like it or not the market has been moving steadily towards a sellers market in the last 2 years, with a recent acceleration of that trend.
Here’s my favourite graph to show the trend of the market. It is annual data to take out all seasonality. I don’t think it gets much clearer than this. The market bottomed out in spring 2013 and has been improving ever since. Of course it could turn around on a dime, but the trend is undeniable.
http://i.imgur.com/uDBOToz.png
I’m not sure if Mark would agree but I think this is a more accurate view of what’s happening price wise. The benchmark house is up 1.2% since last month and 4.4% since last May. Medians and averages jump around too much from month to month. A 3 month median is better, but I don’t believe as accurate as the HPI benchmark formula.
VREB May benchmark price
http://i.cubeupload.com/izXV6r.png
Sales always tend to increase first before prices start to follow, and on the supply side I think the “lousy choices in the single family homes“ is also indicative of a strengthening market.
Mark said: “Last time we have over 900 sales in May was 2007!”
But Greater Victoria single family home median prices are down 2.2% to $557,520 from $570,00. Shouldn’t they be going the other way with record type volumes ? Maybe this is a sign that the top is in with such lousy choices in the single family homes.
With Canadian economy heading into the tank why risk buying now ?
Continuation of lowering of interest rates is not “happy times are here”, it means we are in some serious doo doo.
http://business.financialpost.com/investing/investors-its-time-to-think-again-dismal-data-forcing-serious-re-examination-of-outlook
My guess is for a fairly slow acceleration on the price front, more like 2002. From the rainbow looking chart above, we didn’t exit the last 1994-2002 sideways range very quickly either.
Thanks for the charts.
Nice. Inventory is still relatively high, but at this sales rate that won’t last long.